
Article verified for Release 16.0 on February 11, 2026.
The Answer Distribution view provides detailed insight into how candidates responded to each question in a test. It shows the distribution of selected answer choices across different performance groups, helping you evaluate question difficulty and determine how effectively an item differentiates between stronger and weaker test takers.
This view also includes key item statistics, such as p-value (item difficulty) and Discrimination Index, which support informed decisions when reviewing and improving test content.
Limitations:
How to Access Answer Distribution
To access the answer distribution, follow these steps:
- Navigate to the Tests > Manage tests.
Select the desired test.
Navigate to Questions.
Select the eye icon to view the test version.
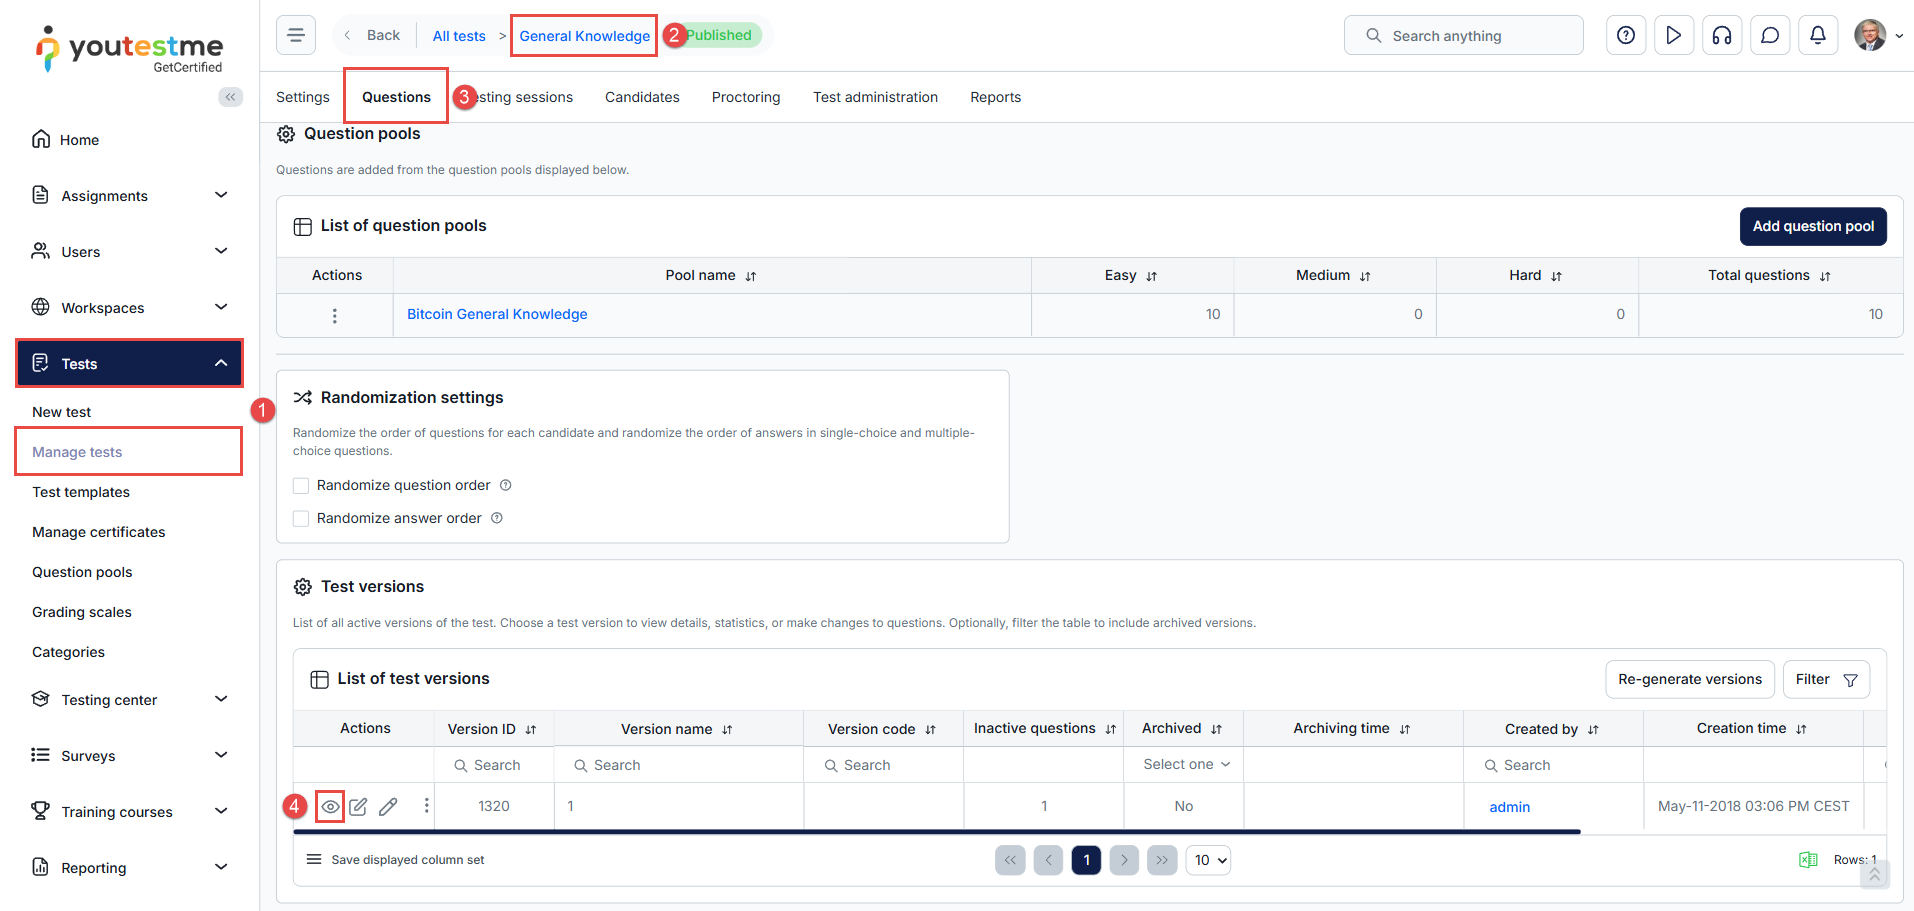
Once the table with questions is displayed:
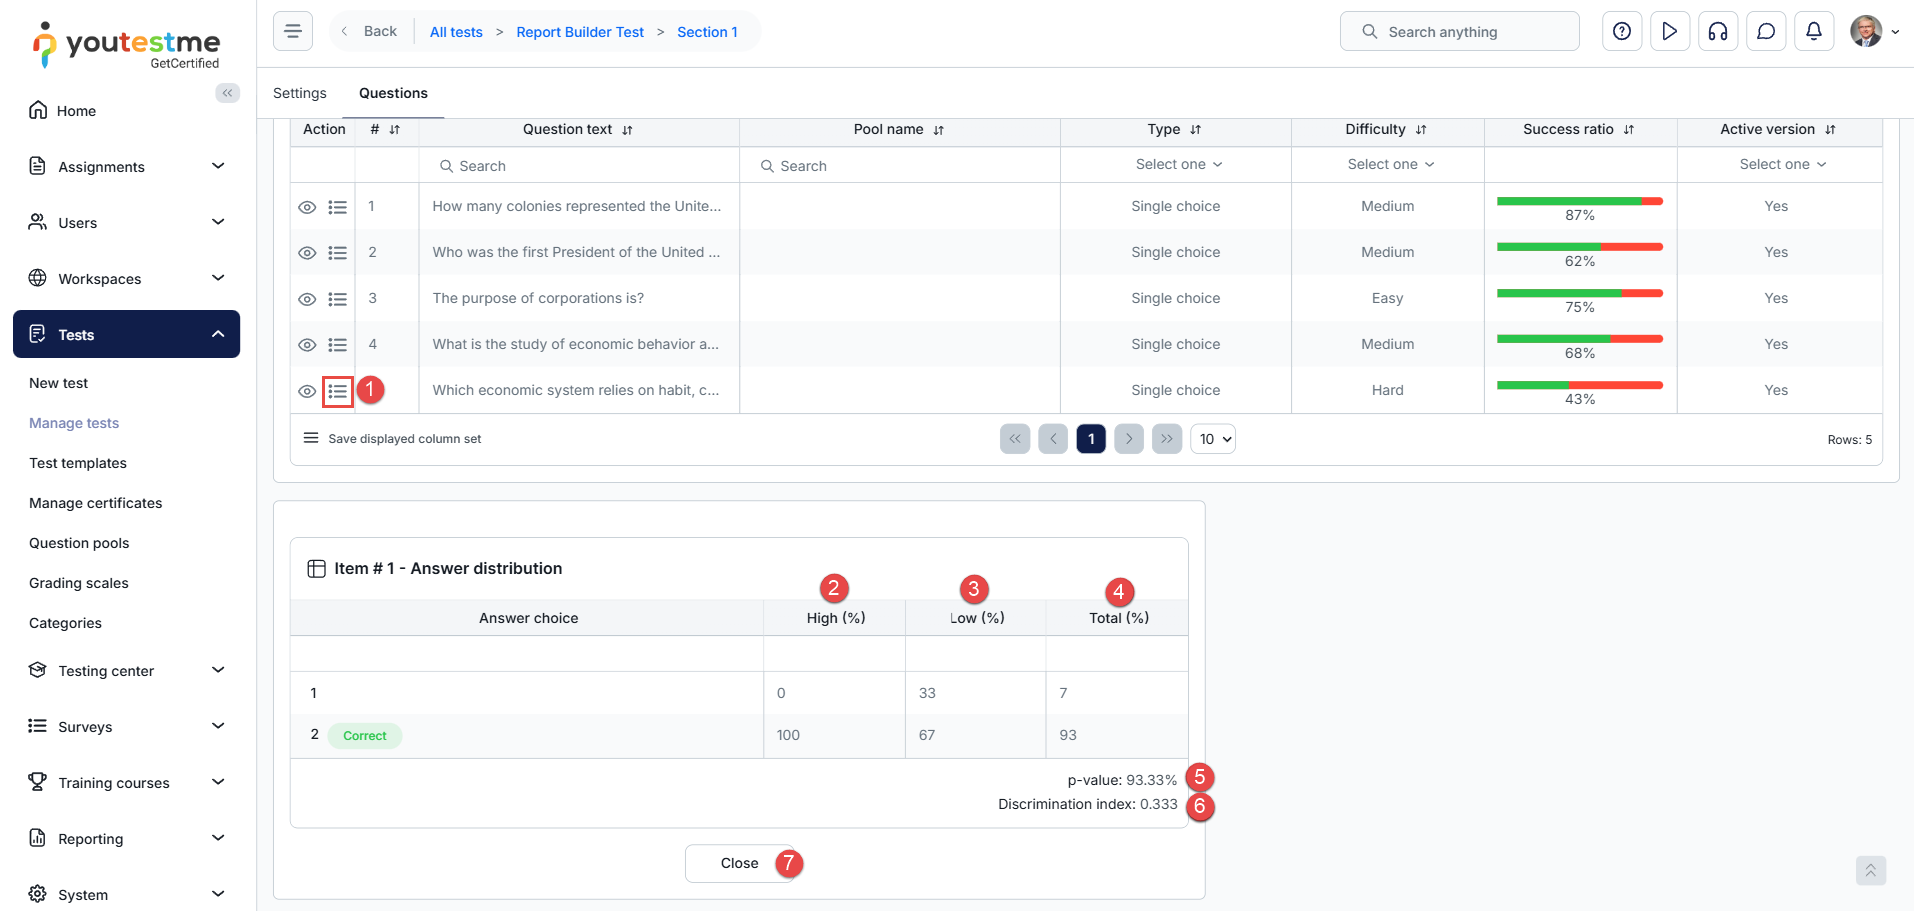
- Select the Answer distribution for the desired question.
- High – Candidates with the highest overall scores on the test (top performance group).
- Low – Candidates with the lowest overall scores on the test (bottom performance group).
- Total – All candidates who answered the question.
-
p-value – The percentage of all candidates who selected the correct answer. Lower values indicate more difficult questions.
p-value (Item Difficulty) is calculated as:
P-value (%) = (Number of correct selected responses / Total number of selected responses) × 100
The result is displayed as a percentage and rounded to two decimal places.
-
Discrimination Index – The difference between the High and Low groups. Higher values indicate better discrimination between stronger and weaker candidates.
The Discrimination Index is calculated by first ranking candidates according to their total test score. The application uses:
- the top 25% of candidates as the high-performing group;
- the bottom 25% of candidates as the low-performing group.
The size of each group is calculated as:
Group size = CEIL(Number of attempts × 0.25)
The Discrimination Index is calculated as:
DI = (Correct responses in High group / Total responses in High group) − (Correct responses in Low group / Total responses in Low group)
or:
DI = PH − PL
where:
- PH = proportion of correct responses in the high-performing group
- PL = proportion of correct responses in the low-performing group
The resulting Discrimination Index is rounded to three decimal places.
- Close – Closes the Answer Distribution card for the current question.
Note: For manually created tests, selecting the Edit questions button generates a new test version. As a result, Answer Distribution data will not be available for that version until at least 10 test attempts have been completed.
Conclusion
The Answer Distribution view provides valuable insight into candidate performance at the question level. By reviewing how different performance groups select answer choices and by analyzing key metrics such as p-value and Discrimination Index, you can better assess question difficulty, identify potential issues with test items, and improve the overall quality of your test content. Regularly reviewing this data helps ensure that test questions are fair, effective, and aligned with the intended assessment goals.
Additional Resources: