
Article verified for Release 15.2 on January 27, 2026.
This article provides a comprehensive guide on conducting Item analysis using YouTestMe GetCertified. Item analysis allows you to assess the reliability and effectiveness of test questions.
There are four ways to conduct item analysis:
- Predefined Test Report – You can utilize the item reliability report provided by YouTestMe GetCertified. This report offers insights into the performance of each test question, allowing you to assess the reliability and effectiveness of the items.
- Report Builder – The platform also offers a report builder feature that enables you to download all the answers to the questions. With this downloaded data, you can perform item analysis independently, gaining more flexibility and control over the analysis process.
- Statistics on Question Level – Within YouTestMe GetCertified, you have access to detailed statistics at the question level. This feature allows you to evaluate the performance, difficulty, and effectiveness of each question in a test.
- Statistics on Answer Level – You can also analyze statistics at the answer level to understand how candidates interact with each possible answer. This provides deeper insights into the quality and clarity of the answer choices, helping to refine test questions further.
Using predefined test reports
To access the Item Reliability report, follow the next steps:
- Click the Reporting option in the main menu, and select Predefined Reports.
- Click on Test Reports.

- Choose the Item reliability report.

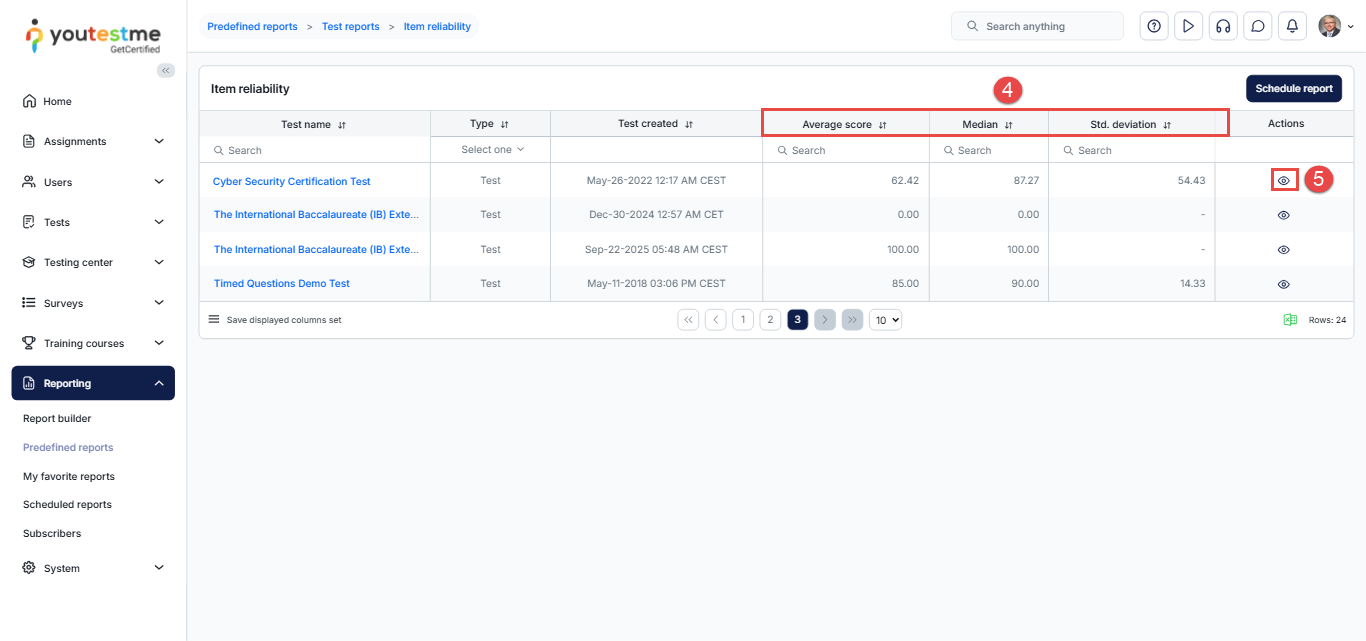
- You can view the following statistical information about each test:
- Average score – The average score achieved by all candidates who completed the test.
- Median – The middle score when all candidates’ test scores are arranged from lowest to highest.
- Std. deviation – The standard deviation of the candidates’ scores, indicating how much the scores vary from the average score.
- Click the Details button of the desired test to preview each question’s success ratio and item reliability.
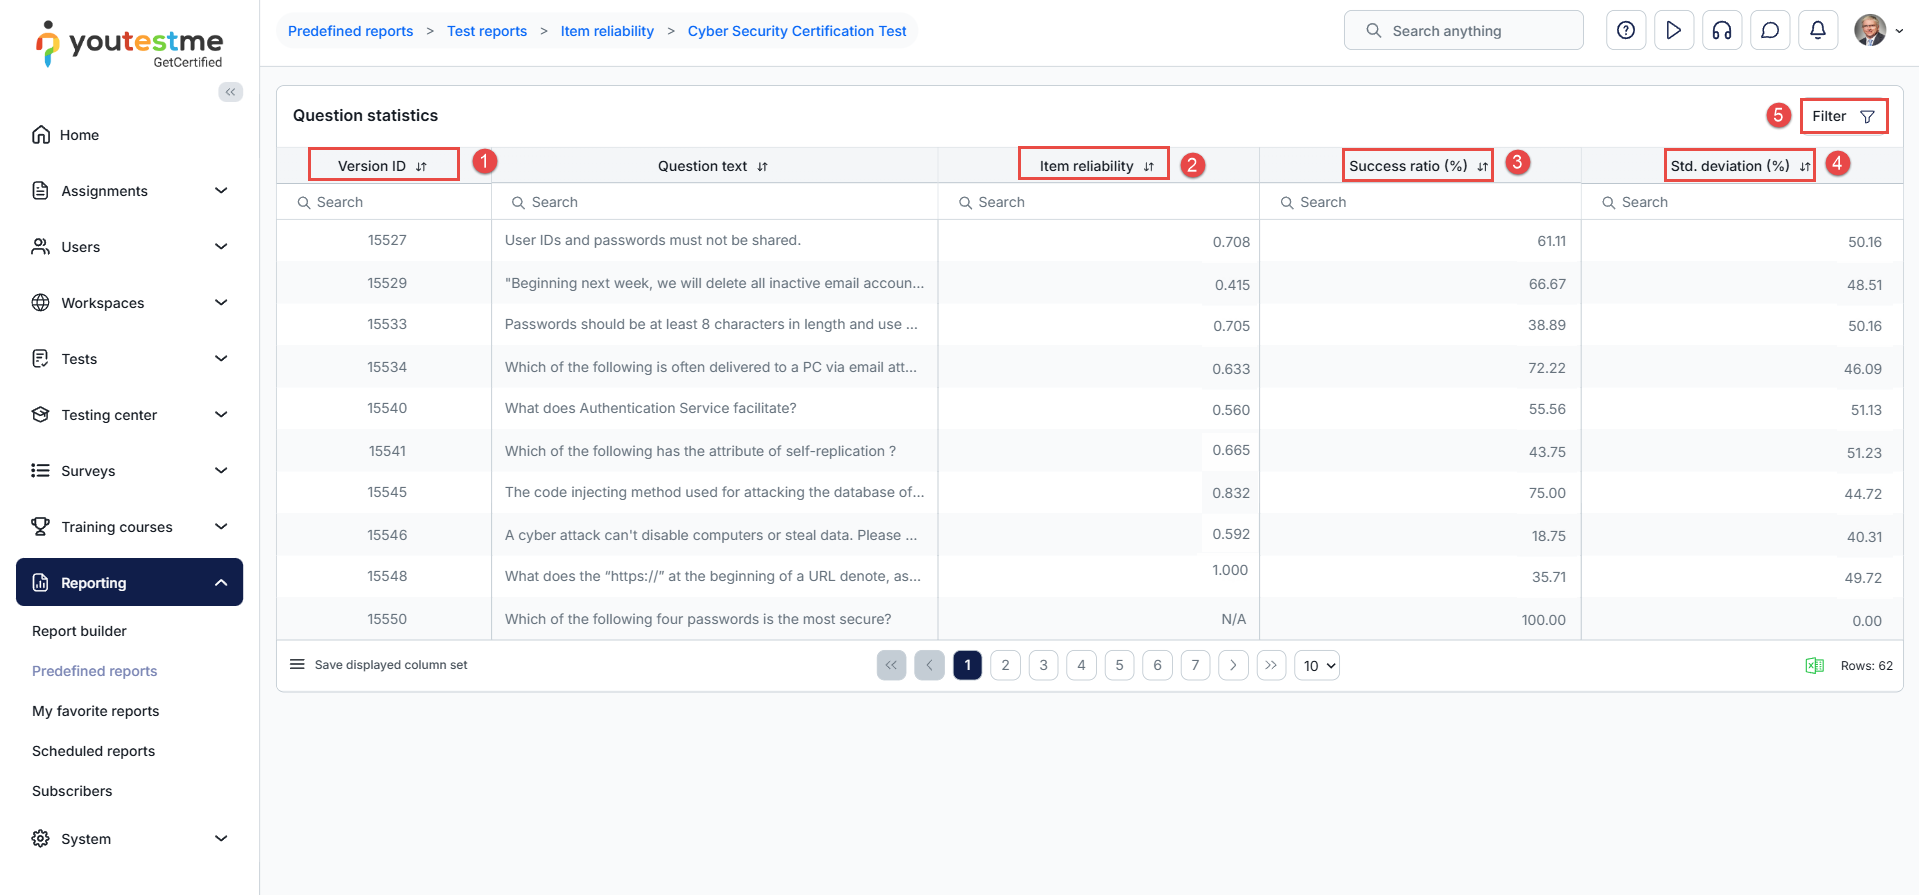
On the displayed screen, the following metrics are shown:
- Version ID is a unique identifier assigned to a specific version of the question. Each time the question is edited, a new Version ID is generated. (Upcoming feature)
- Item reliability indicates how strongly an individual item correlates with the overall test performance. The reliability/correlation metric is calculated as the Pearson correlation between the score achieved on the item and the total score achieved on the test.
The calculation uses the following formula:
r = Σ[(Xi − X̄)(Ti − T̄)] / √(Σ(Xi − X̄)² × Σ(Ti − T̄)²)
where:
- Xi = candidate’s score on the item
- X̄ = mean item score
- Ti = candidate’s total test score
- T̄ = mean total test score
The implementation uses PearsonsCorrelation.
The values can range between -1 and 1.
Negative values usually mean that:
- Candidates who got lower scores on the exam answered this question correctly.
- Candidates who got higher scores on the exam answered this question incorrectly.
In this case, the question does not correlate well with overall exam performance, and you may want to exclude it from the next exam versions or substitute it.
Positive values usually mean that:
- Candidates who got higher scores on the exam answered this question correctly.
- Candidates who got lower scores on the exam answered this question incorrectly.
In this case, the question correlates positively with overall exam performance and should generally be included in the next exam versions.
Note: For tests with sections, the analysis must be accessed separately for each section. If you click Details for the overall test rather than for an individual section, the data in this column will not be displayed and will appear as N/A.
- The success ratio provides the percentage of candidates who answered the question correctly.
- Standard deviation measures the variability of success ratios for individual questions, helping identify inconsistent performance and correlations between question difficulty and overall test scores
- Filter – Use the filter to display inactive questions. By default, only active questions are shown. (Upcoming feature)
Note: Questions added through any branching mode are excluded from the Item Reliability report. Only finished attempts are shown in the statistics.
Using report builder
- To access the report builder from the main application menu, select the Reporting tab in the left-side menu and select the Report Builder tab.
- Select the test using the Name column or ID to display a Report Builder for a specific test.

For detailed instructions on how to create custom reports using Report Builder, please visit this article
Statistics on Question Level
- Navigate to Test and select Manage Test.
- Open the desired test.
- Go to the Questions tab.
- In the list of test versions, click on the eye icon from the Action tab.

- Scroll down to view the statistics for each question in the test.
You have the option to compare questions by success ratio, time to answer, and question occurrence
- Success ratio: a percentage of users who answered the question correctly.

- Time to answer: The time spent on the question before an answer was provided.

- Question occurrence: a percentage of test versions that contain the question.

Statistics on Answer Level
To see statistics at the answer level for each question, follow these steps:
- From the list of questions, choose the desired question.
- Click on the eye icon in the Action tab.

- Scroll down to view the statistics at the answer level.

For more useful instructional materials, please visit:
- How to Use Custom Question Properties in the Report Builder
- How to Create Custom Reports Using Report Builder
- How to Access and Use Predefined Reports