
Article verified for Release 15.2 on December 13, 2025
This article explains how administrators can access and preview the Performance Monitoring report that displays the number of connected users in the system. This report is useful for system monitoring, capacity planning, and usage analysis.
Opening the Performance Monitoring Report
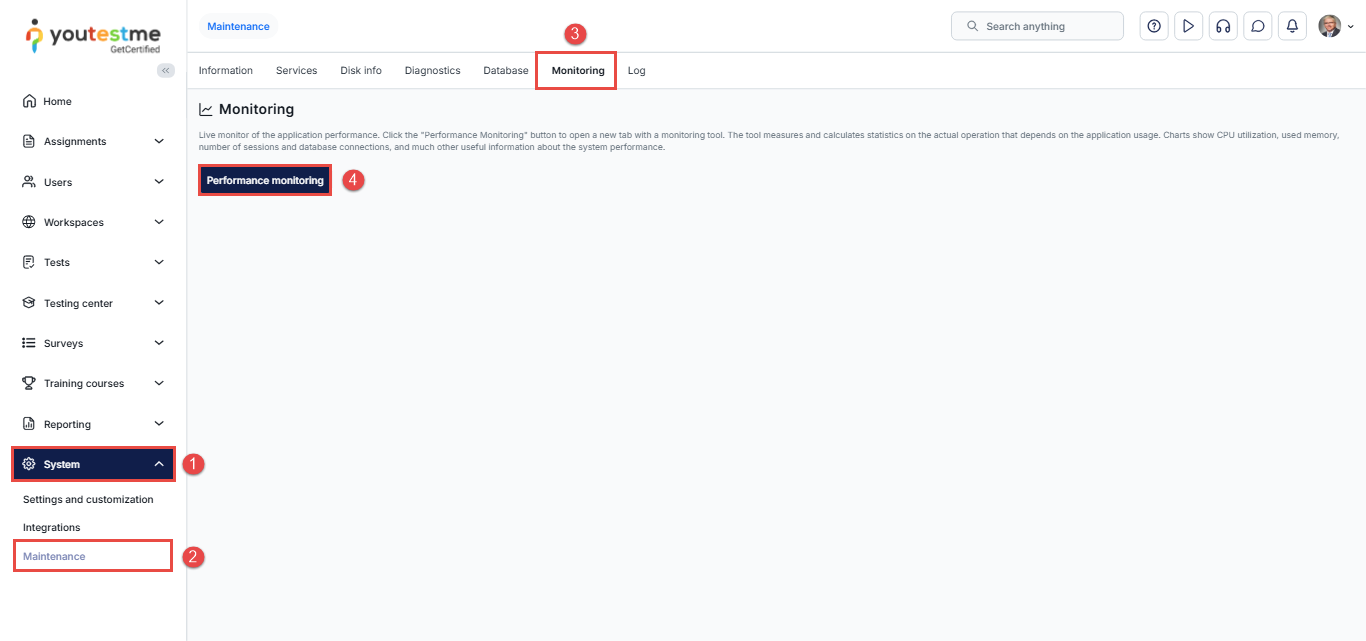
To access the report, follow these steps:
- From the main menu, hover over the System tab.
- Select Maintenance from the drop-down menu.
- Open the Monitoring tab.
- Click Performance Monitoring.
There are two ways to view the statistics report containing the number of concurrent users:
- Click the HTTP sessions to preview connected users’ reports when you choose (During the day, in this case).
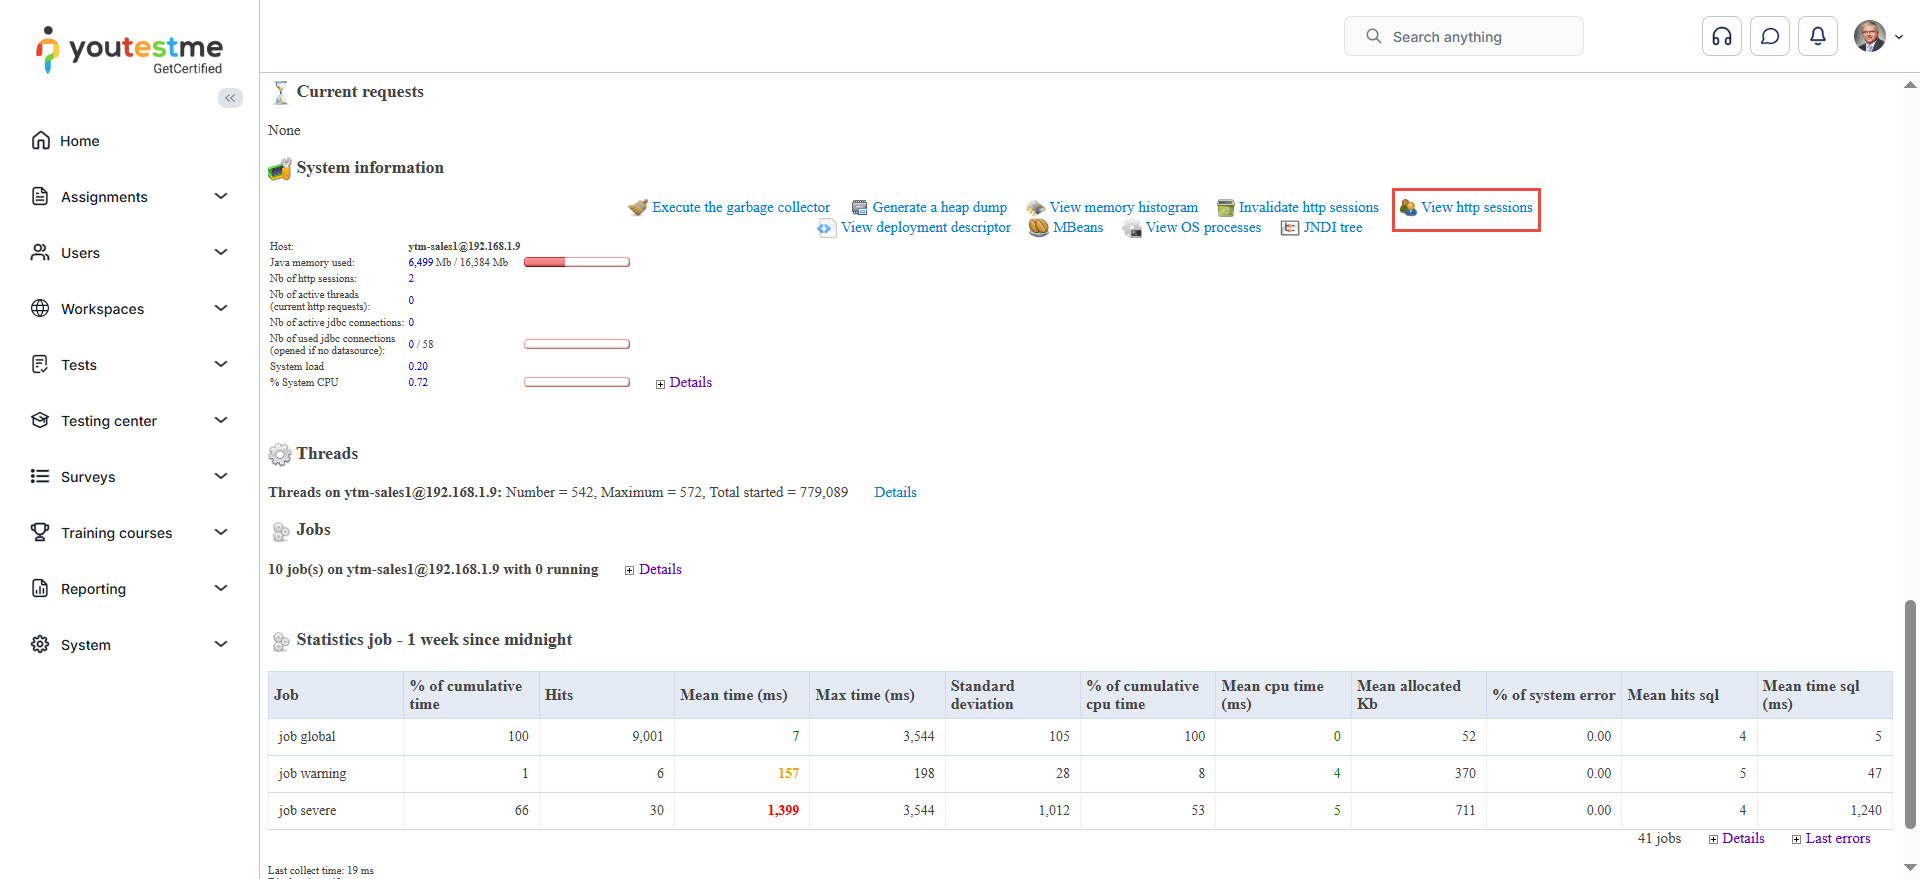
- On the same page, under System information, click the link View HTTP sessions.
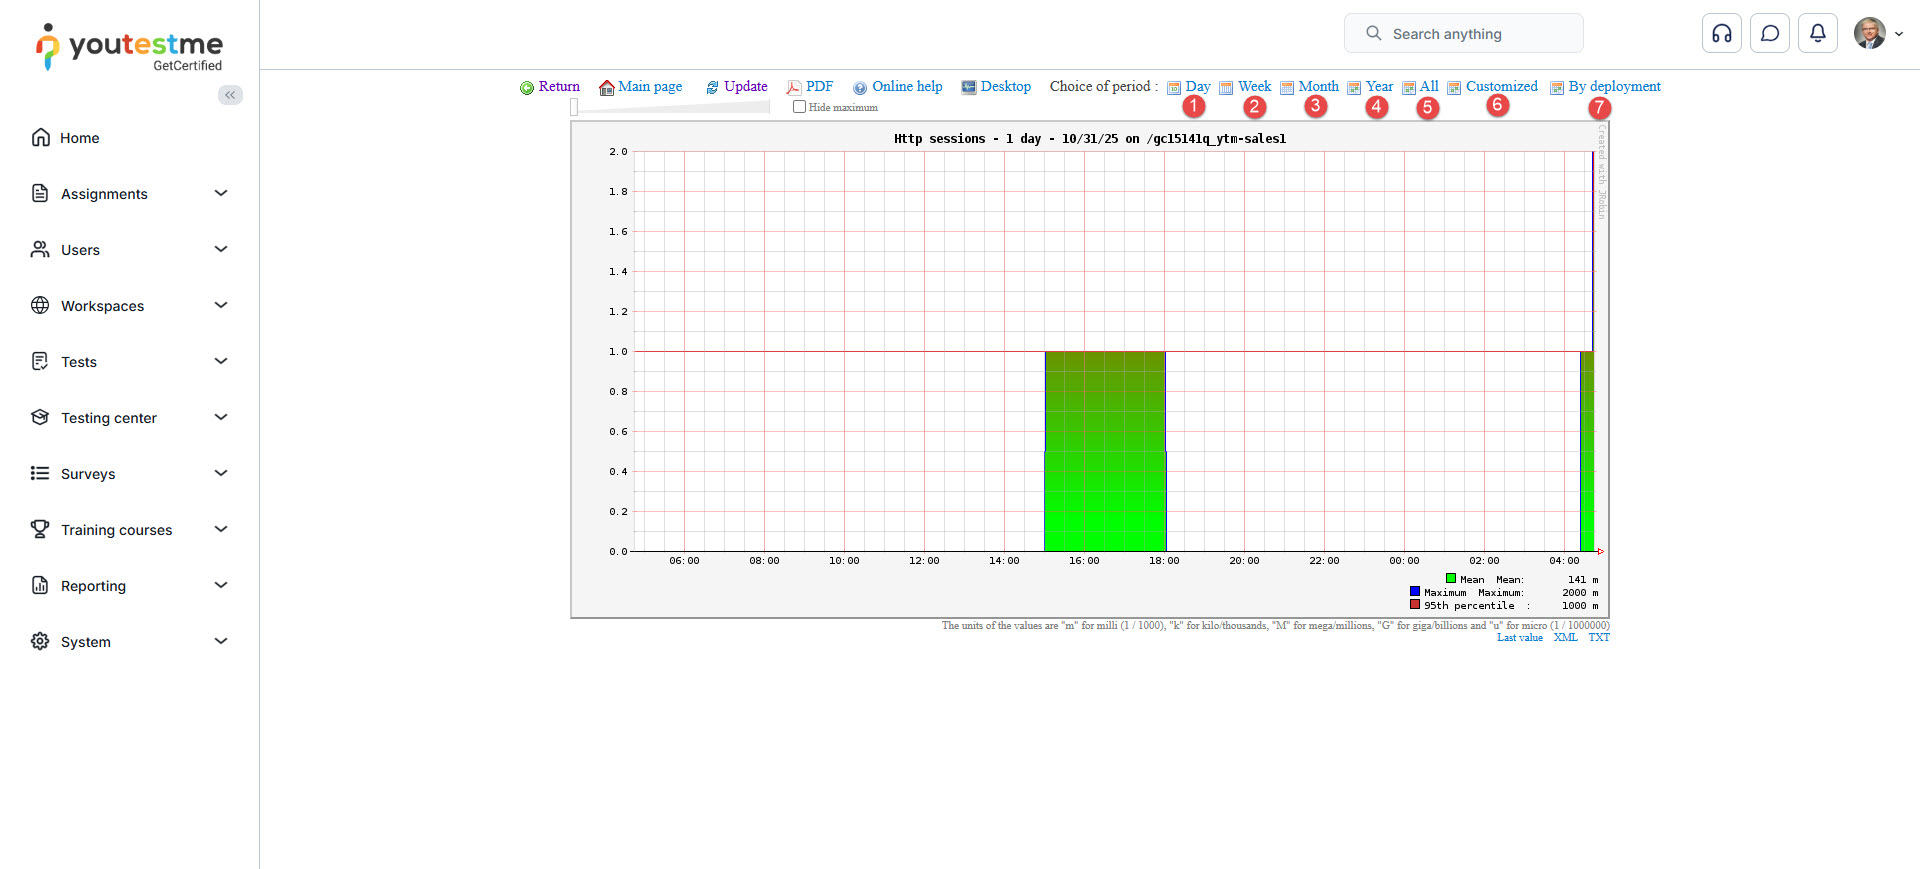
The first way to preview a report is to click the HTTP sessions
You can see in the picture the statistics of monitoring taken on the exact date and the exact time, divided by categories.
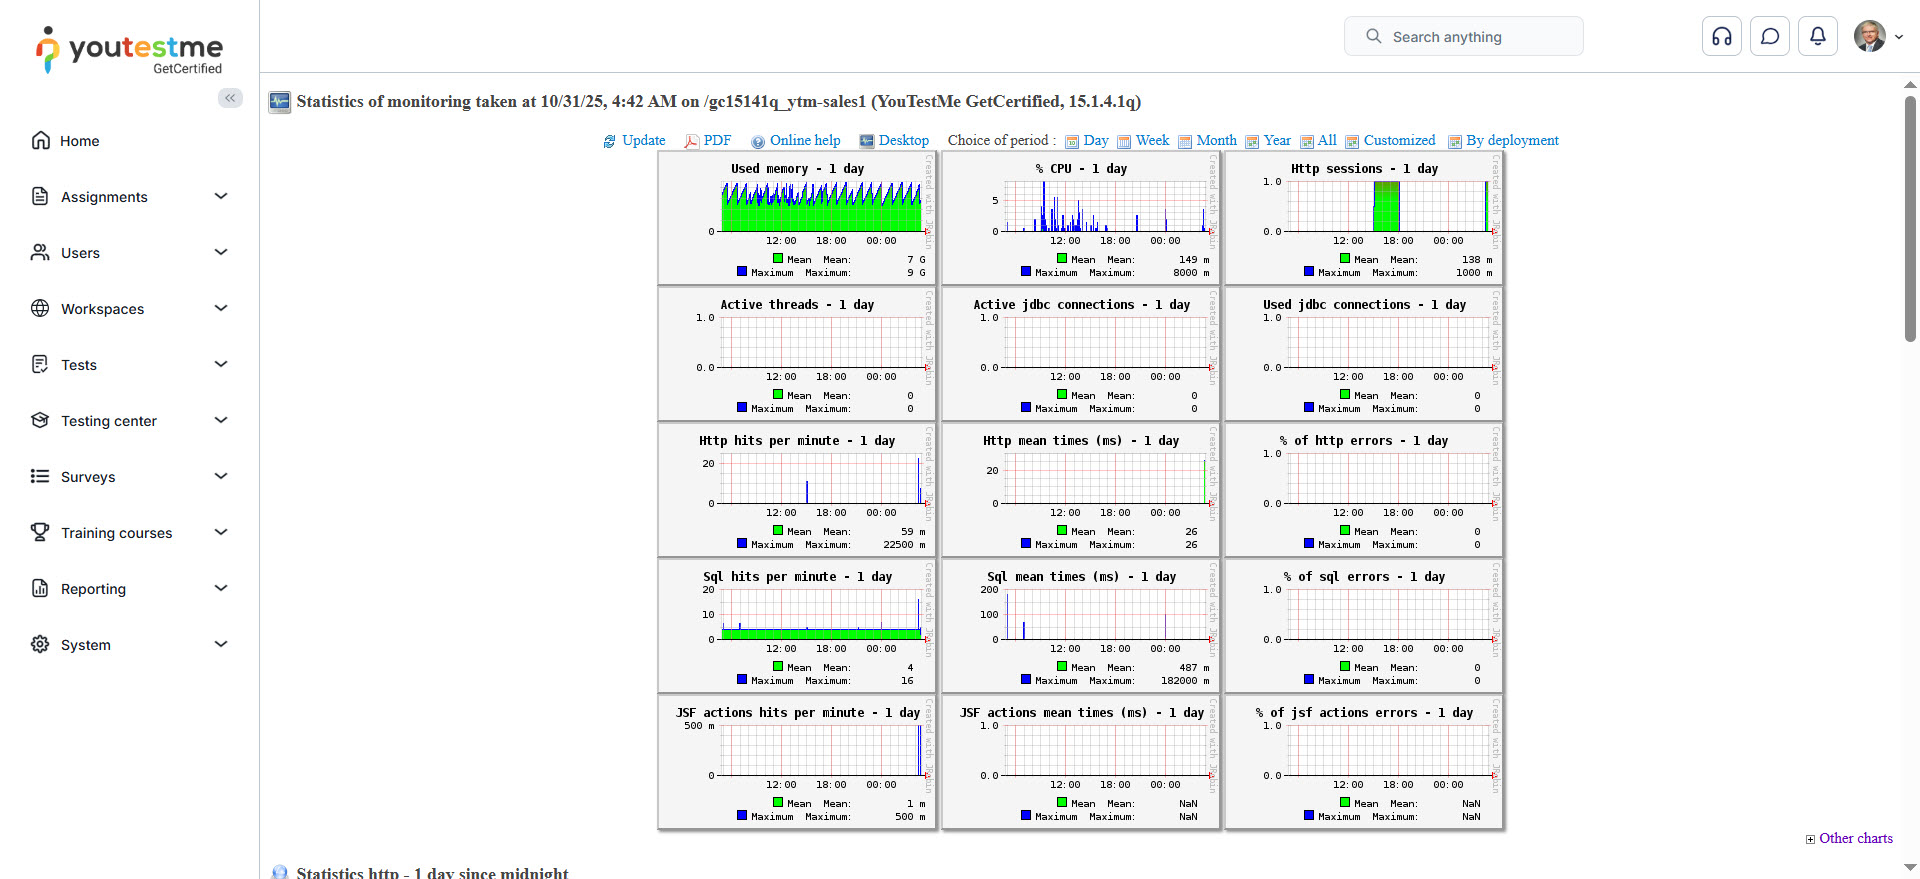
After choosing the HTTP sessions-1-day option, you can see the report that shows the number of HTTP sessions per day. The report shows the duration of the session for each user. The number of users signed in to the application within the time shown on the chart. The monitoring tool tracks the number of users signed in to the session, measured by time.
Take a look at the chart report below, and there you can preview the number of HTTP sessions during a day.
Note: One HTTP session is equivalent to one signed-in user.
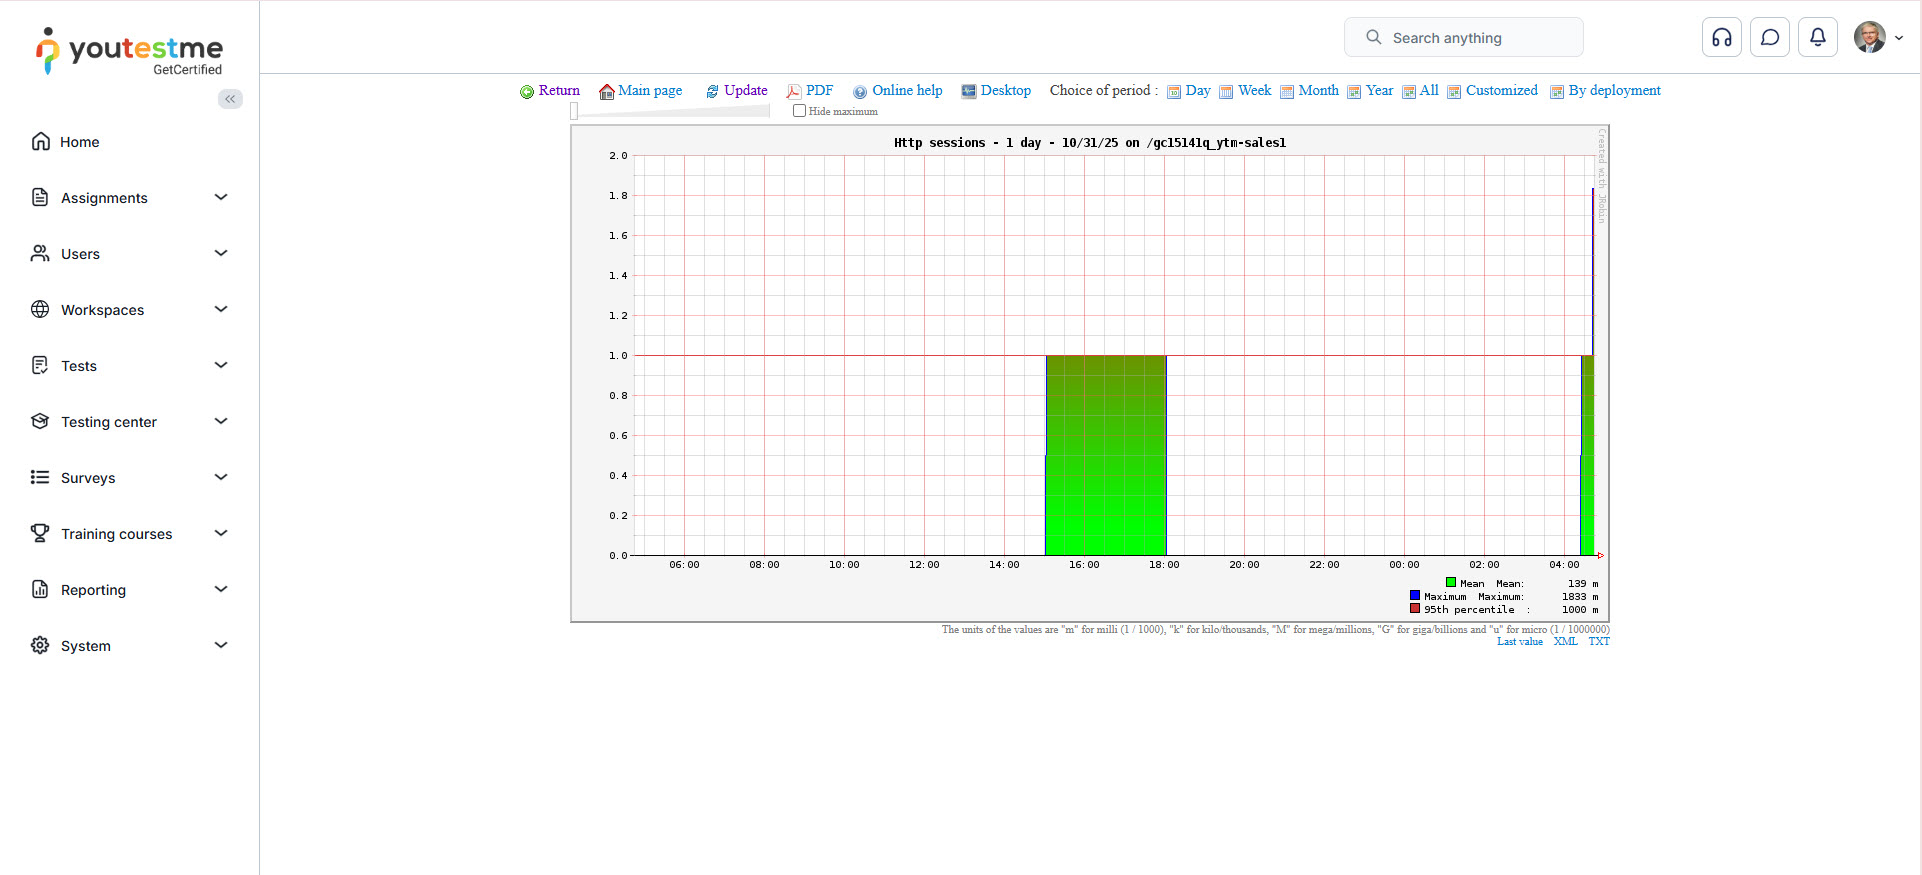
There are the following actions are available with the HTTP sessions report:
- Return – returns you to the monitoring home page.
- Return to the monitoring page (monitoring home page).
- Update the chart (information).
- Display reports in PDF format.
- Display online help on a new page– opens the help of a monitoring tool.
- Download the monitoring tool on your computer.
One more option is available, and that is that you can change the period you will preview the report. You can choose:
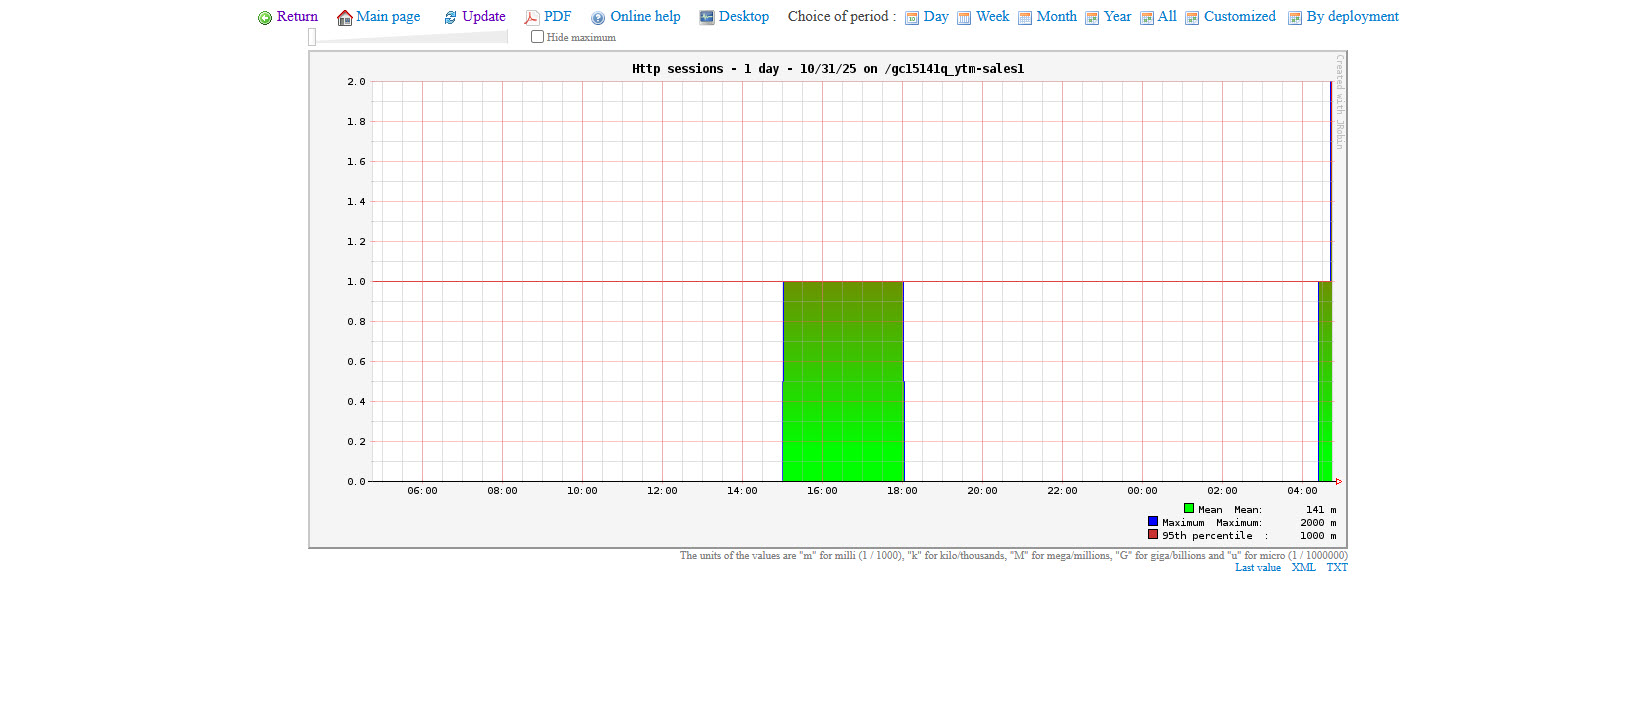
- Day – preview daily statistics report.
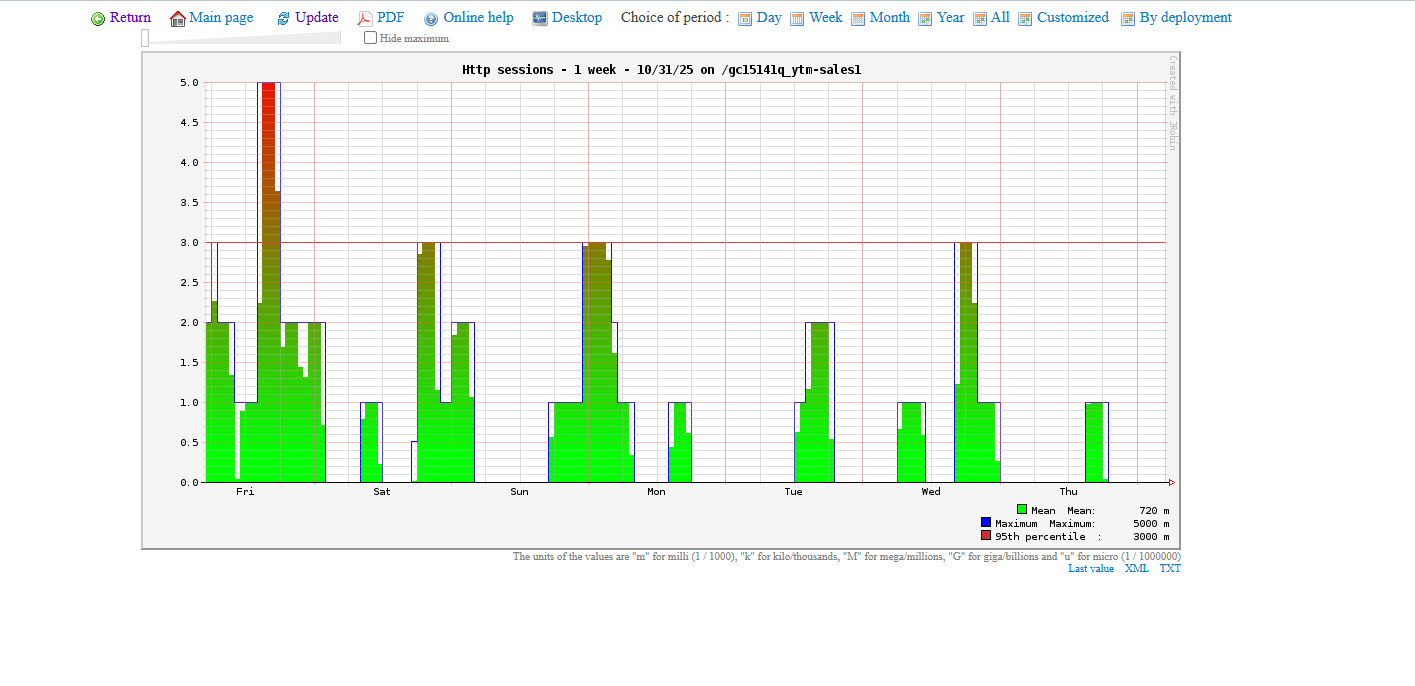
- Week – preview weekly statistics report.
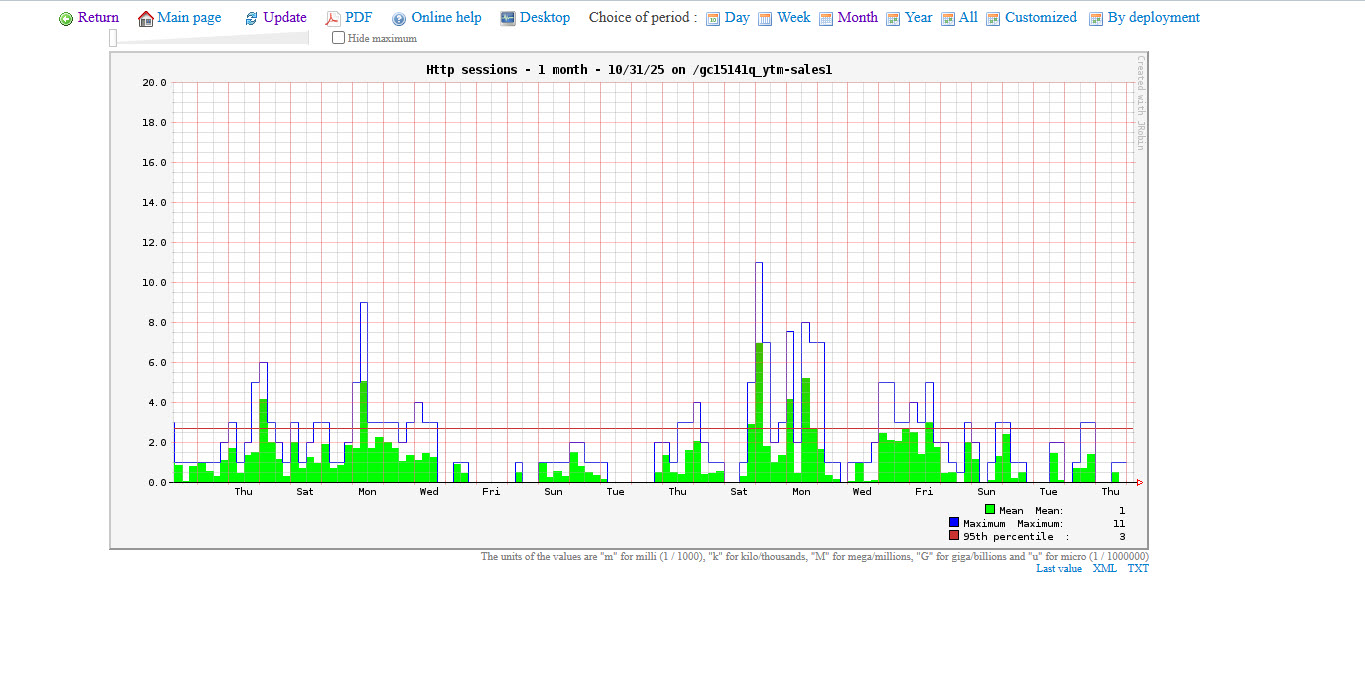
- Month – preview the monthly statistics report.
- Year – preview yearly statistics report.
- All – preview the report for all periods.
- Customized – select the period from date to date to show the report.
- By deployment – choose the version of a system to preview for reporting.
Connected users’ daily statistics report
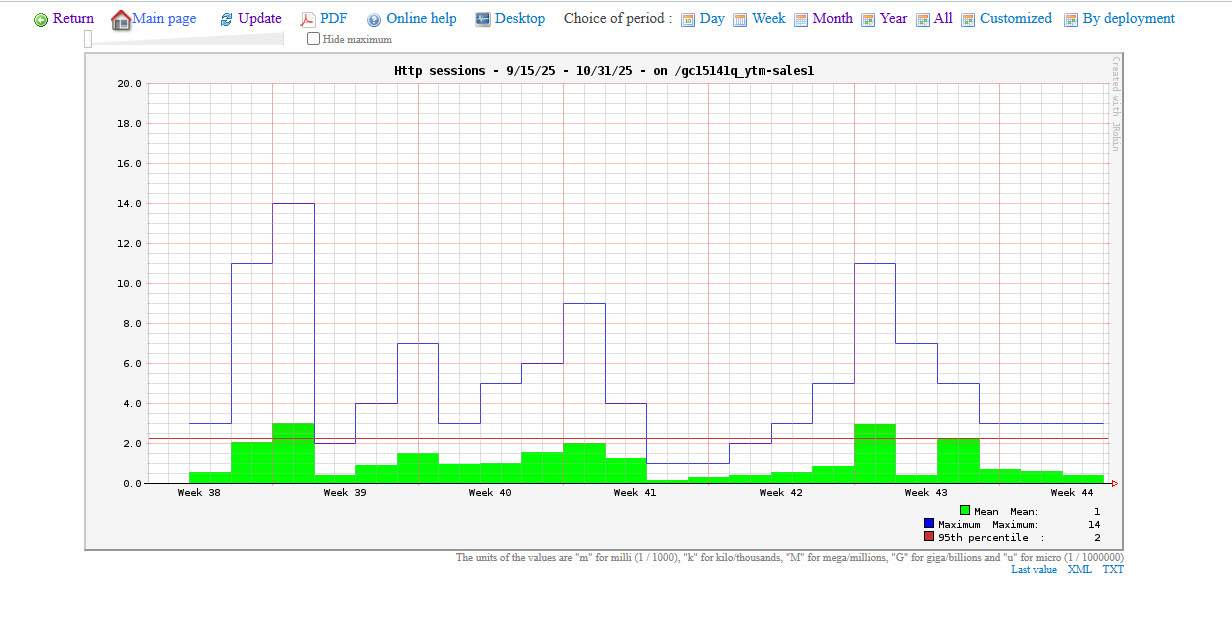
Connected users’ weekly statistics report
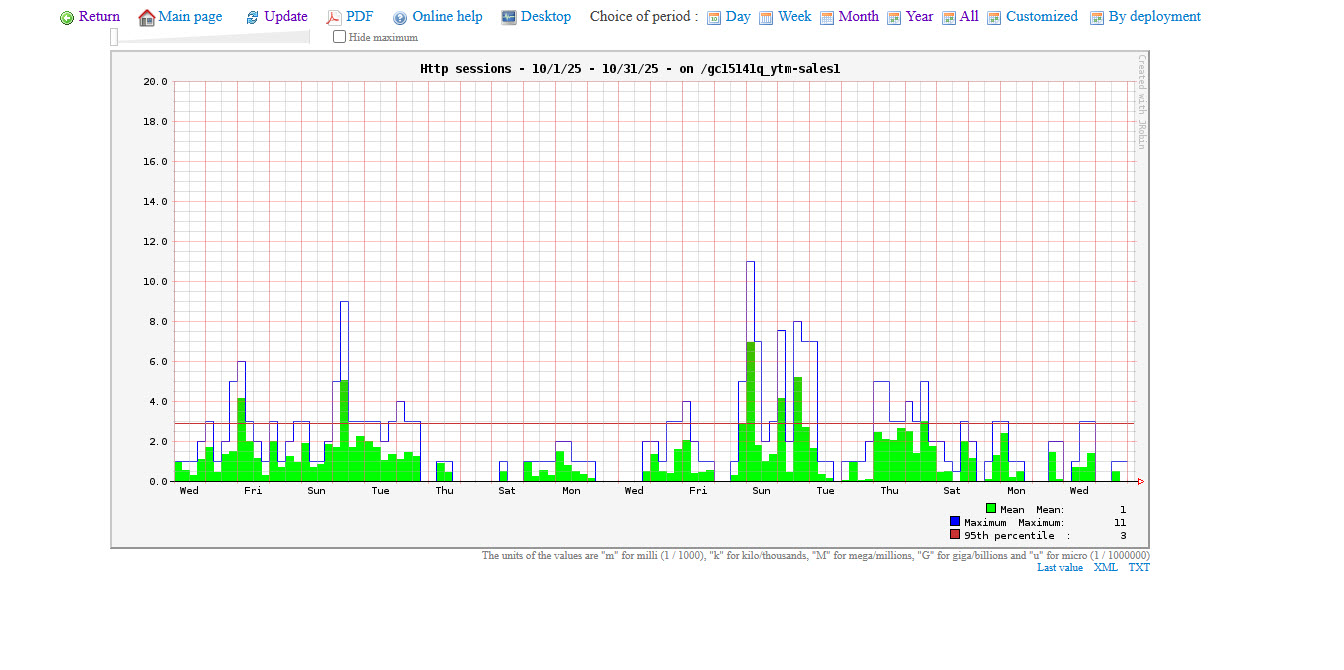
Connected users’ monthly statistics report
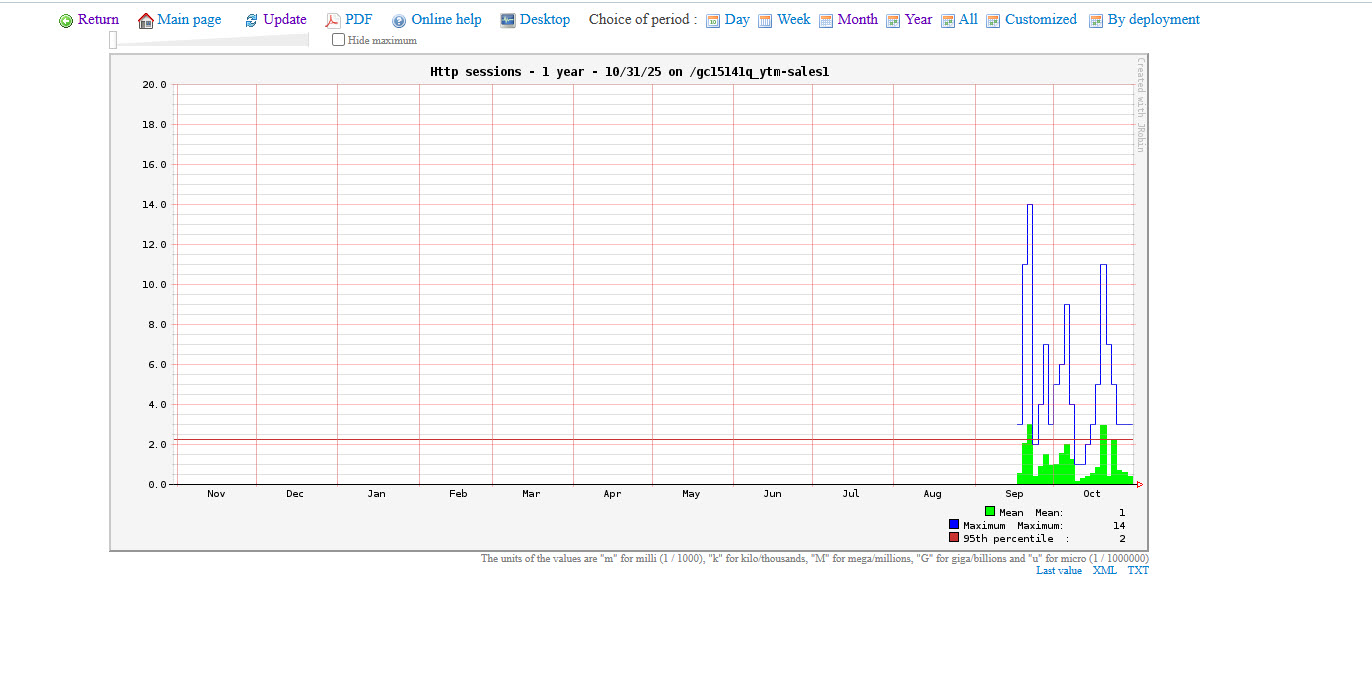
Connected users’ yearly statistics report
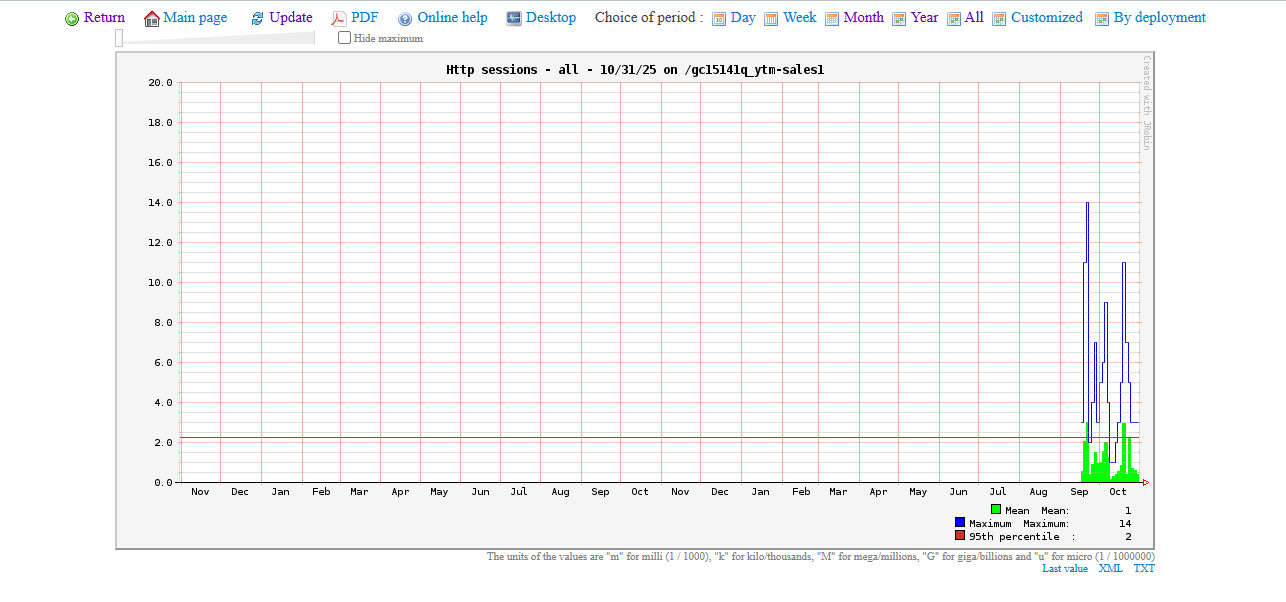
Connected users report – all the periods
Connected users – Customized report
Connected users – By deployment report
The second way to preview a report is to click the View HTTP sessions link
You can see the following columns in the report:
- Session ID – the identification number of a session.
- Last access – the moment when the user accessed the session.
- Age – represents the duration of a session.
- Expiration – the exact time when the session expires.
- IP address – represents the IP address of a user.
- Country – the location of the user signed in to the HTTP session.
- Browser – the browser from which the user started the session.
- OS – the operating system of a user’s computer.
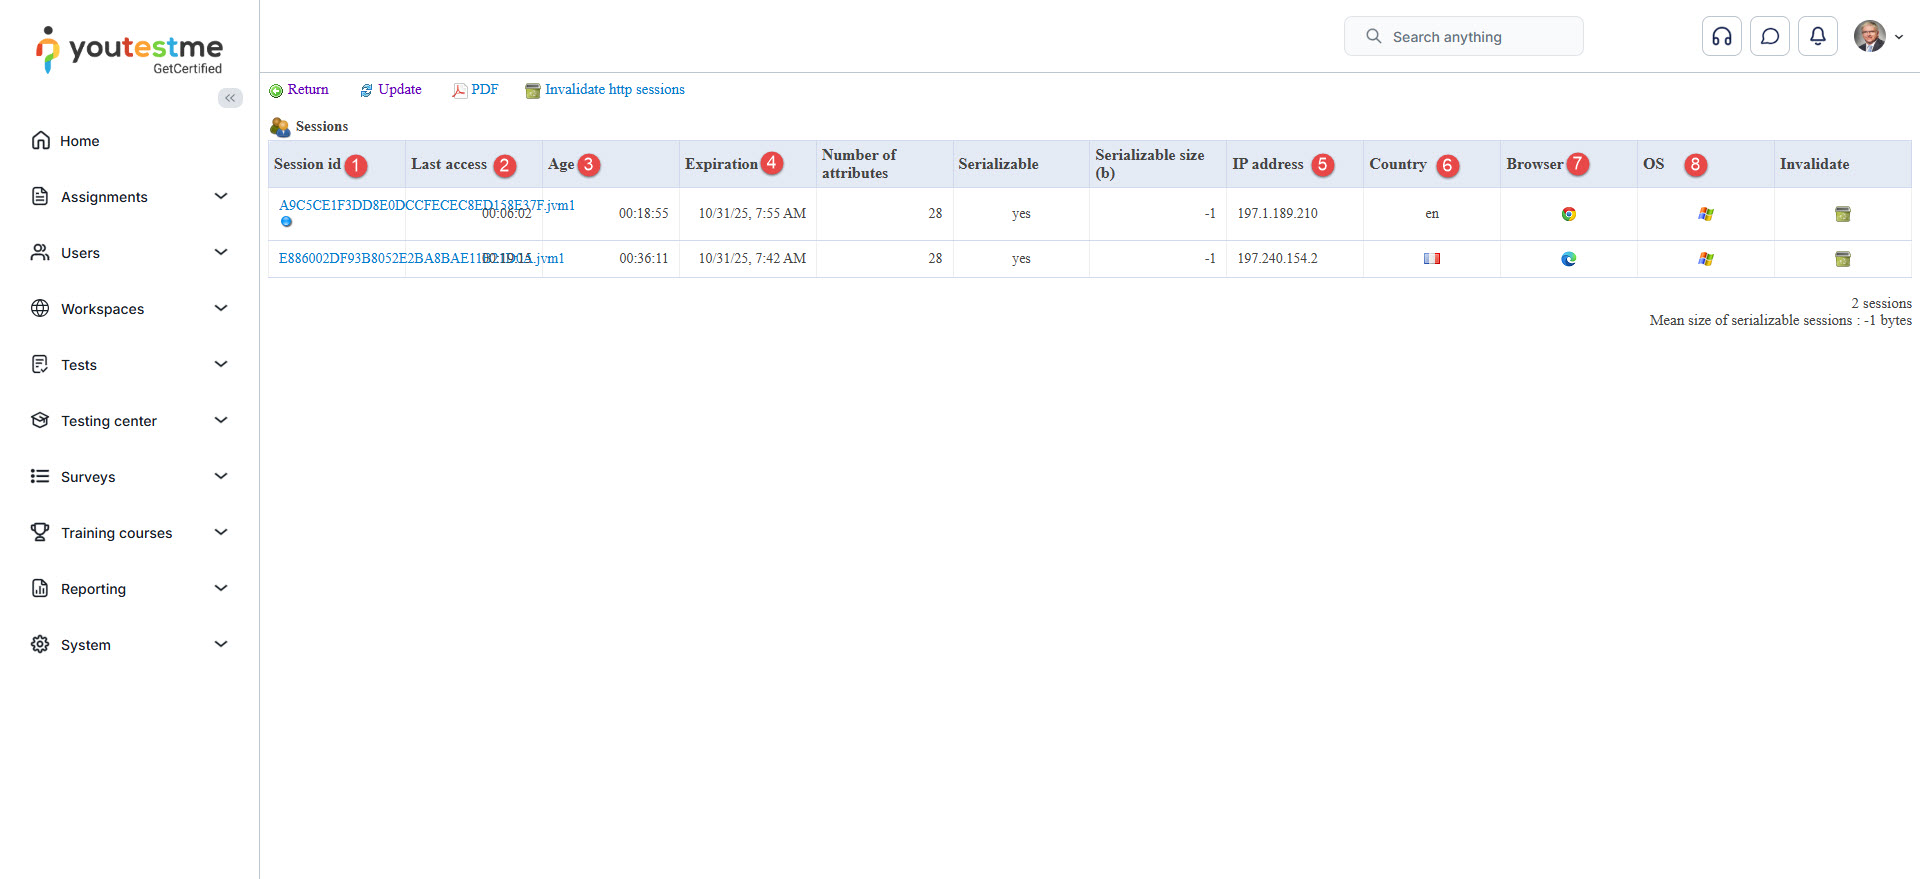
Note: These column attributes are essential for an administrator and the statistical analysis. The field’s Number of attributes, Serializable, and Serializable size are the additional attributes in the table.
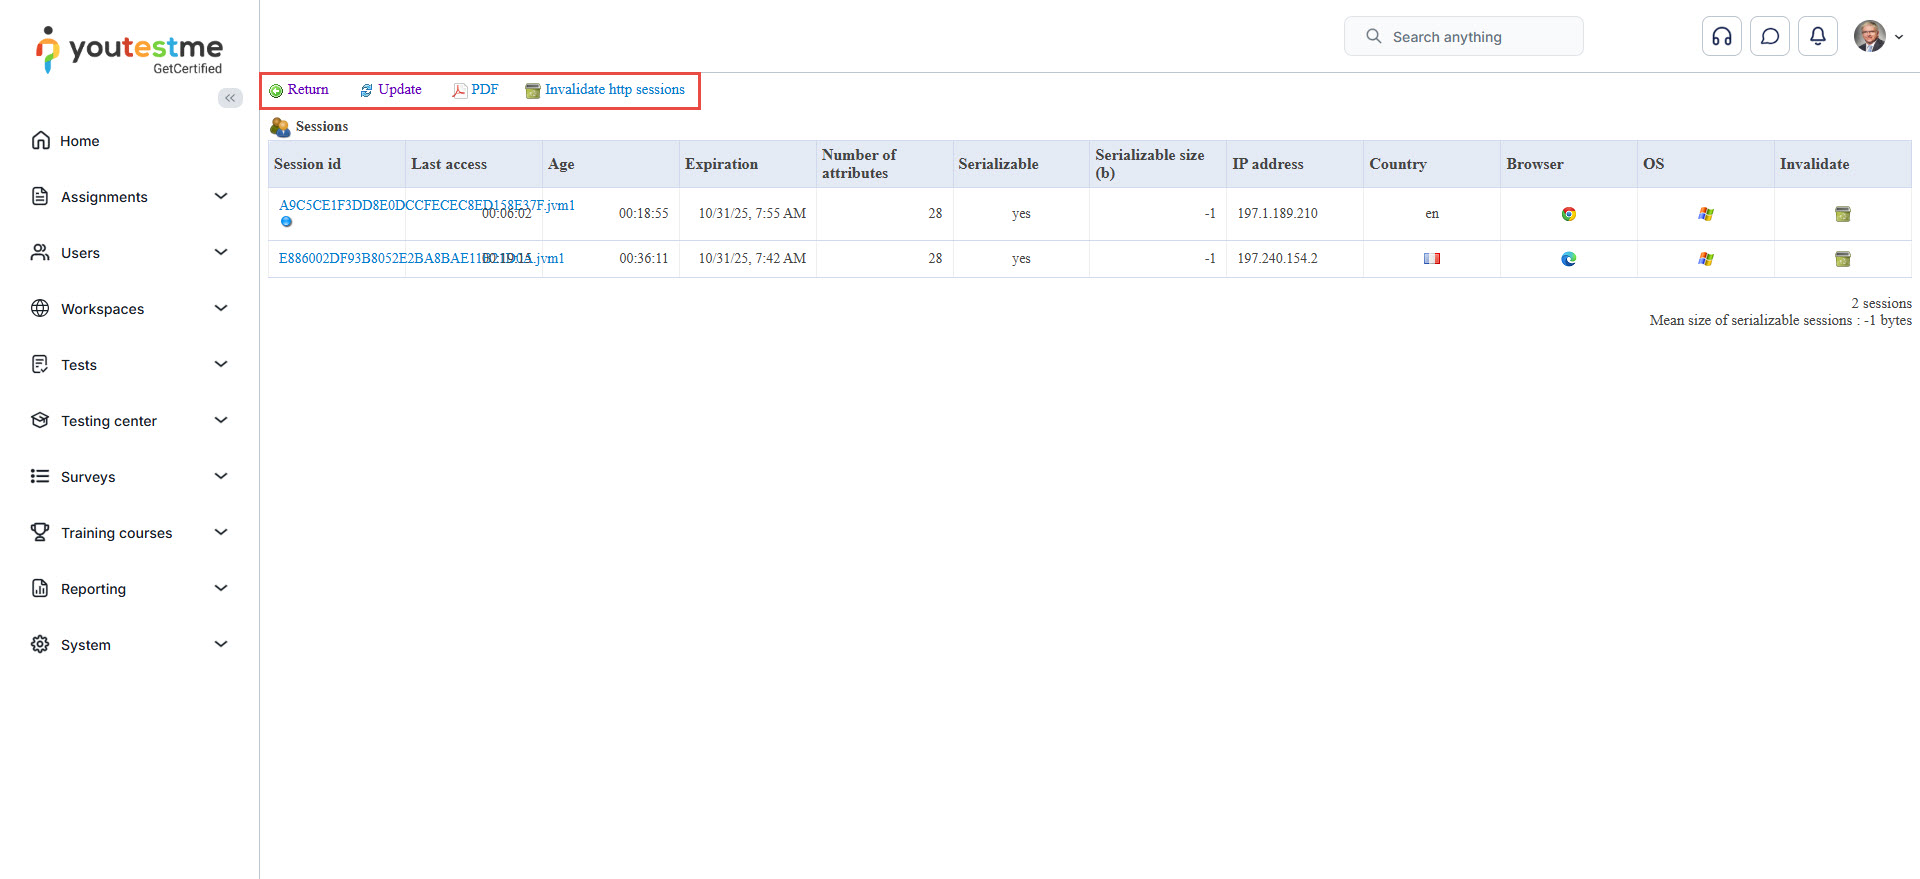
You can perform the following actions as well:
- Return.
- Update the table.
- Display the report in PDF format.
- Invalidate the HTTP sessions.
For more related articles, please refer to:
- How to Access and Use Predefined Reports
- How to Track Question Reports by Pool
- How to Access and Use Predefined Reports
