
This article provides guidance on accessing two essential reports: the Exam Questions Report and the Summary Report.
After the completion of an exam in the YouTestMe system, it automatically generates two statistical reports:
- The Summary Report: This report provides insights into the average and median scores, the standard deviation, the exam success ratio, and facilitates result comparisons across different sessions and testing locations.
- The Exam Questions Report: This report details the success ratio for each question, the average time taken to answer, and the percentage of chosen answers.
Summary Report
This report gives you access to a comprehensive summary of test attempt scores and progress, both globally and segmented by testing sessions and locations.
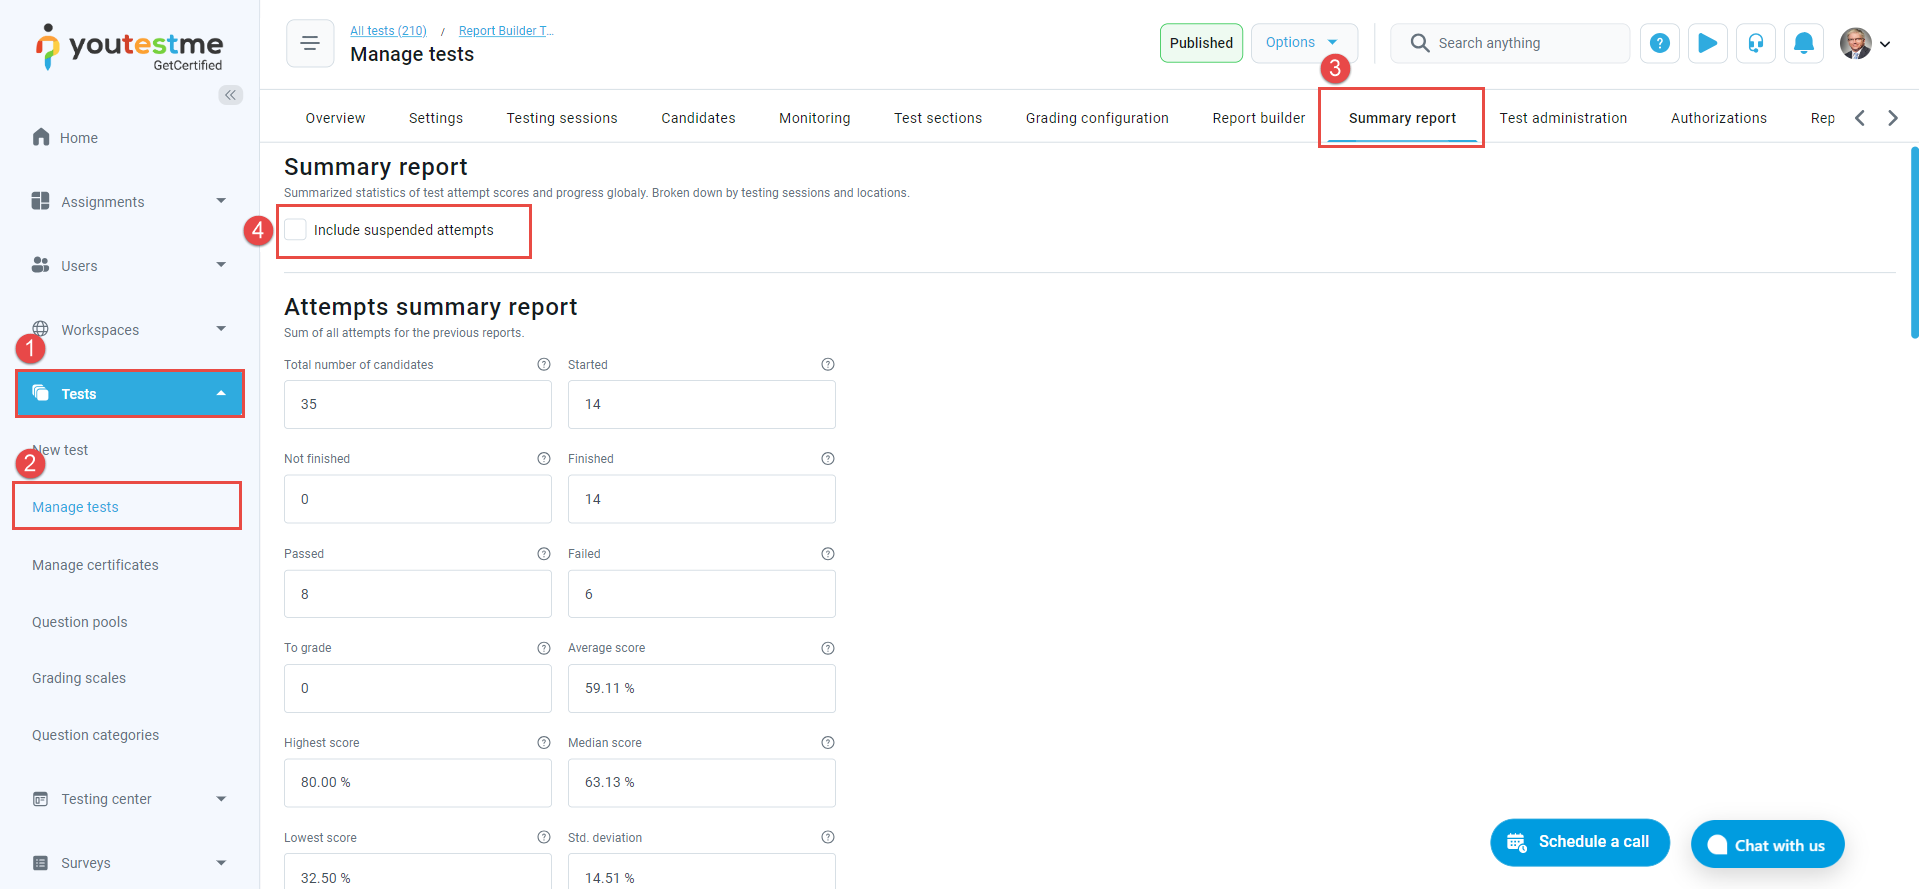
To access the summary report, please follow these steps:
- In the main menu, go to Tests.
- Then, navigate to Manage tests.
- Click on the name of the desired test and navigate to Summary Report.
- You have the option to include or exclude suspended attempts by selecting or deselecting the checkbox labeled Include Suspended Attempts.
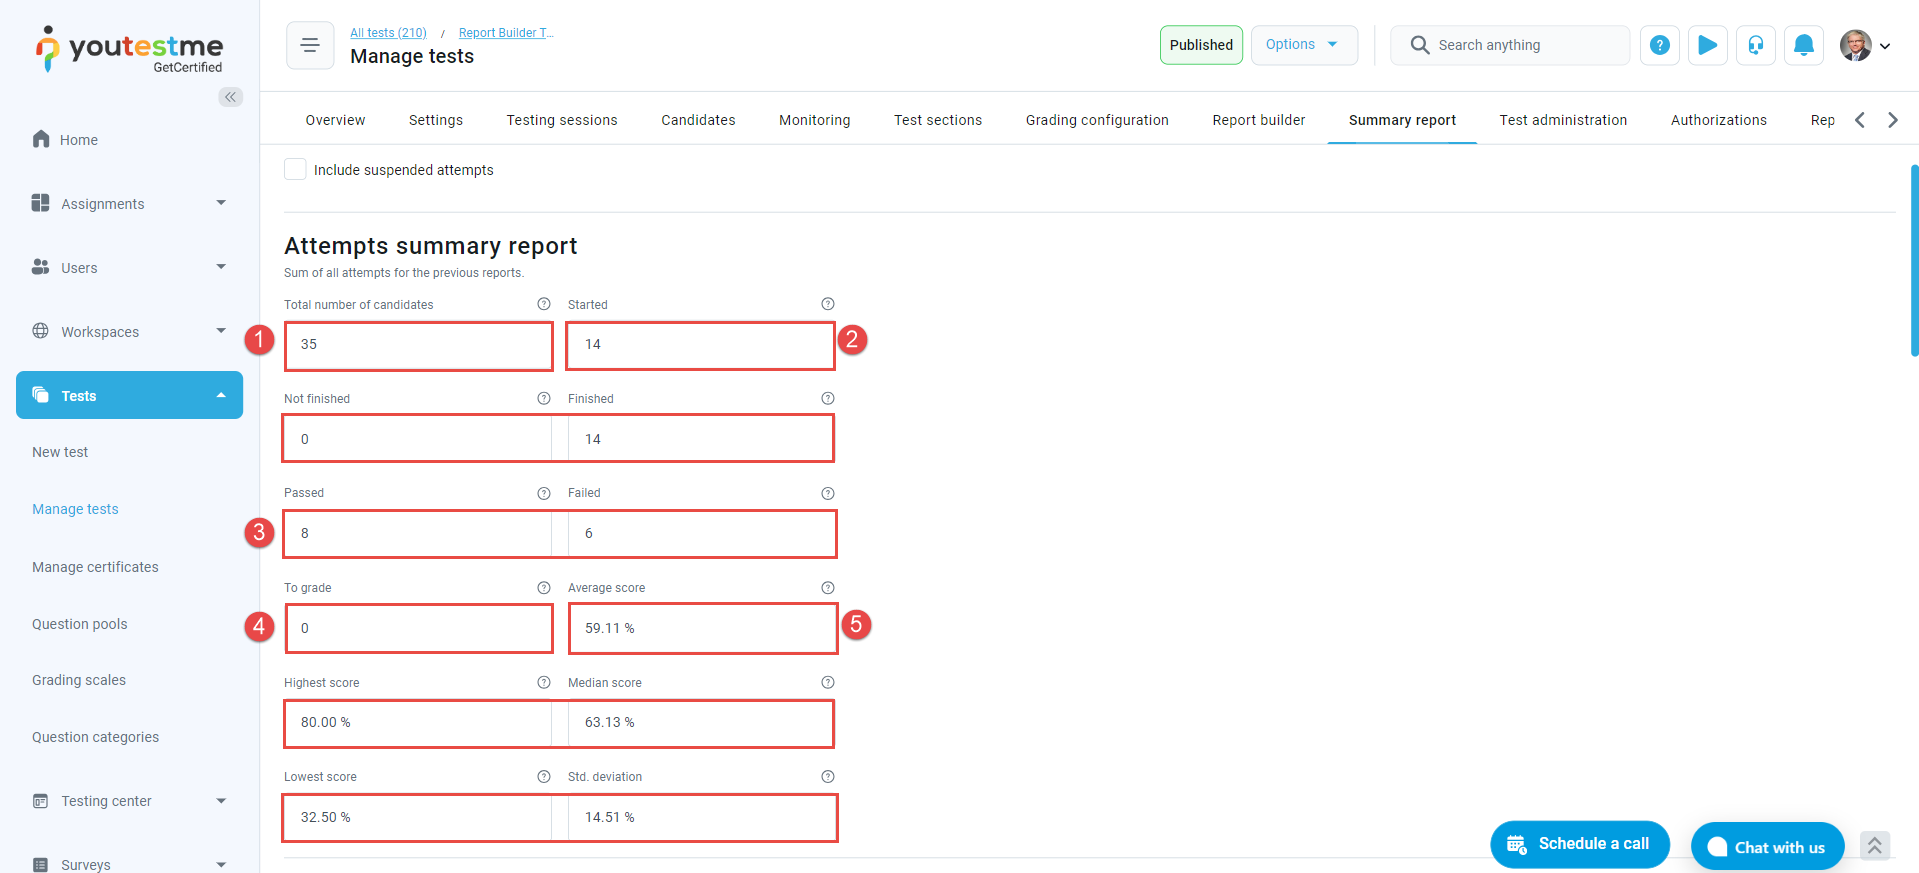
In the Attempts Summary Report, you gain access to comprehensive global statistics related to test attempts, including:
- The total number of candidates who either booked or were assigned to the test.
- The count of candidates who initiated the test,, completed it, and those who didn’t finish.
- The number of candidates who successfully passed the test and those who failed.
- The number of attempts that require grading.
- Key statistics such as the average, lowest, highest, and median scores, along with the standard deviation.
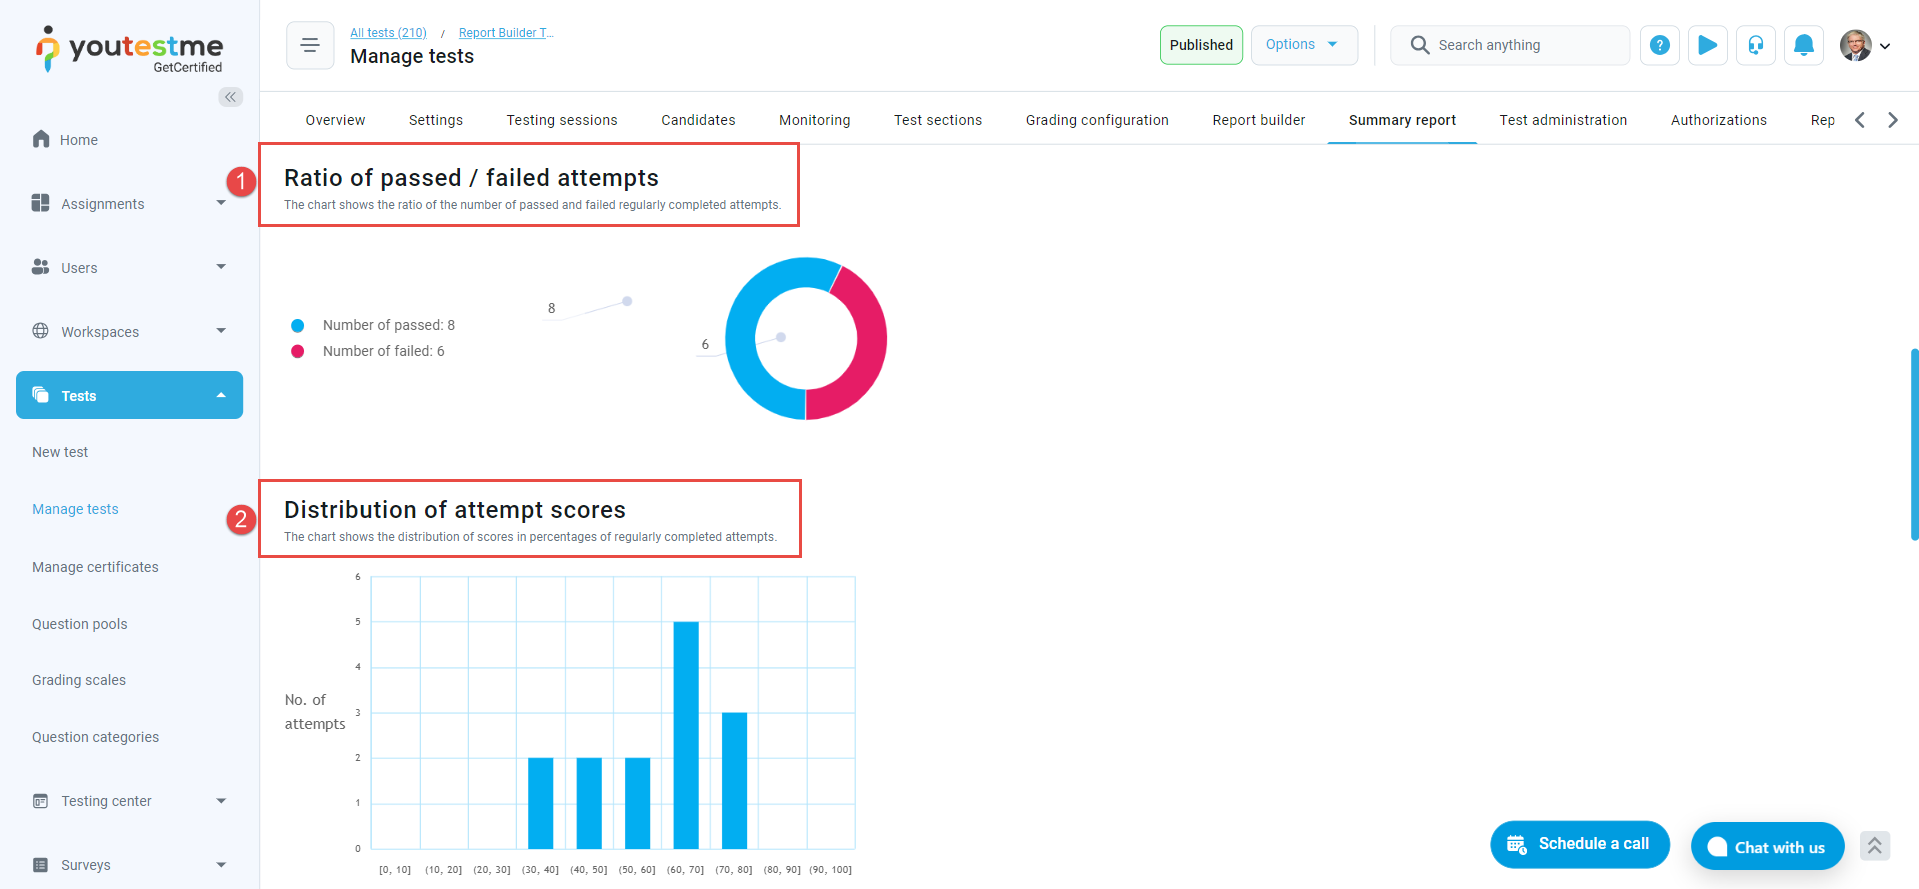
The Summary report also features charts that display:
- The ratio of passed and failed candidates
- The distribution of scores in percentages for attempts that were successfully completed.
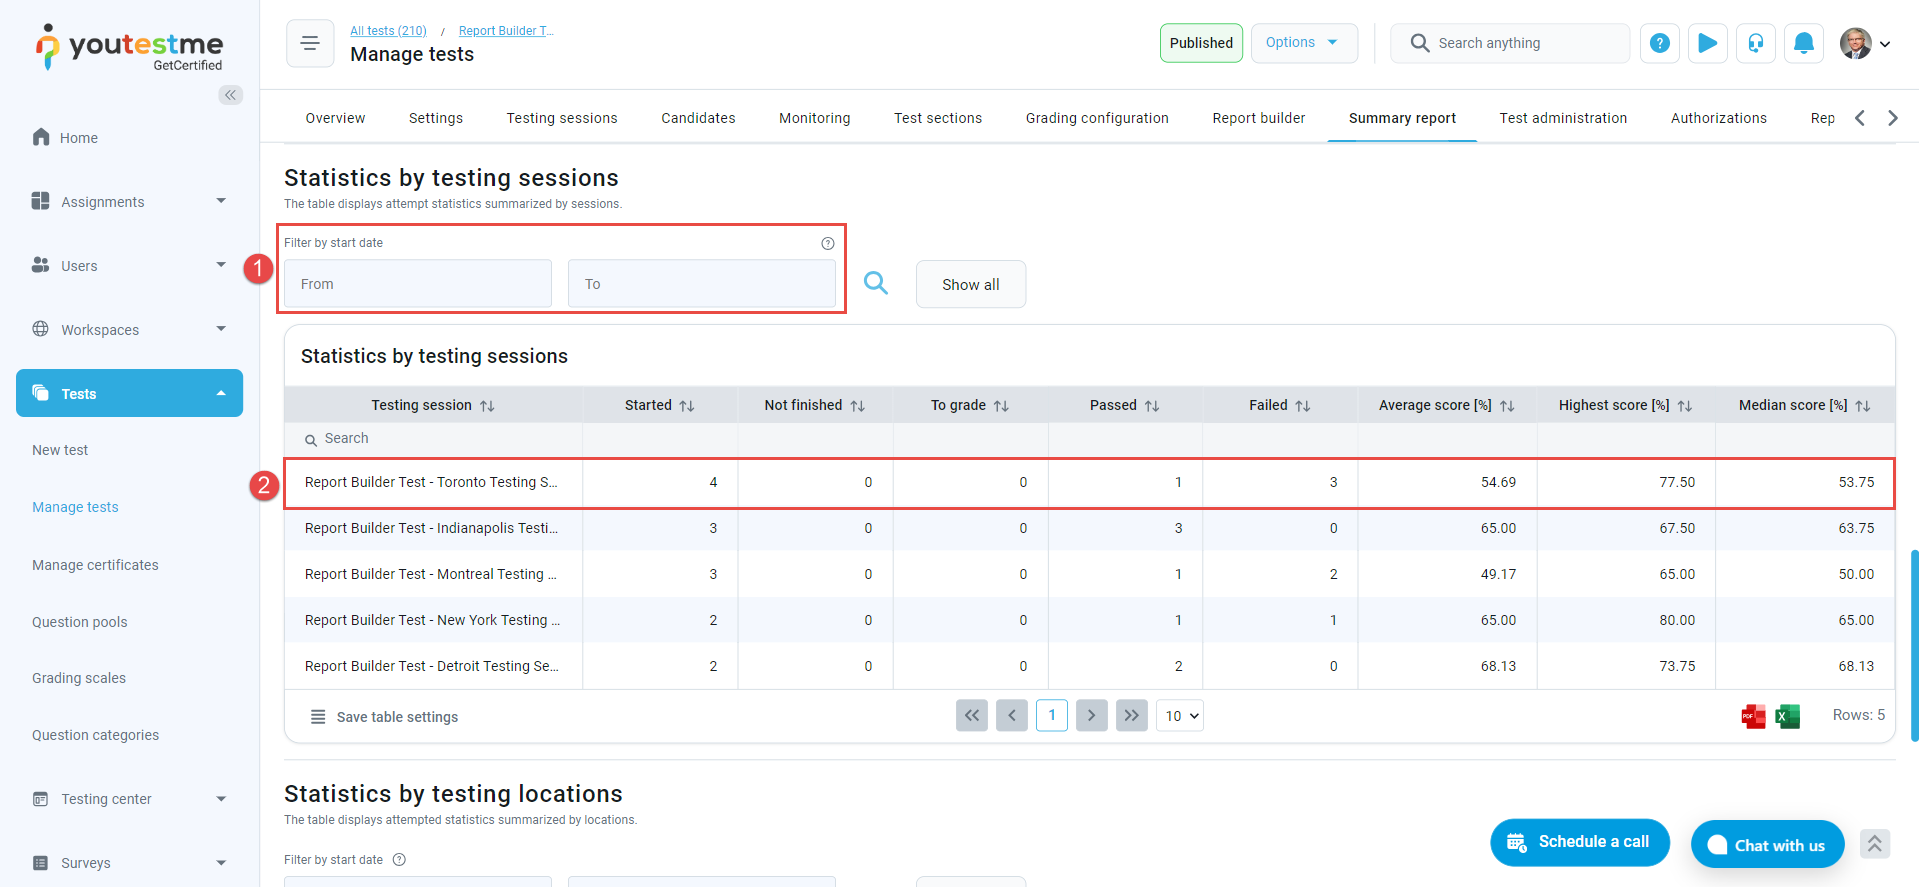
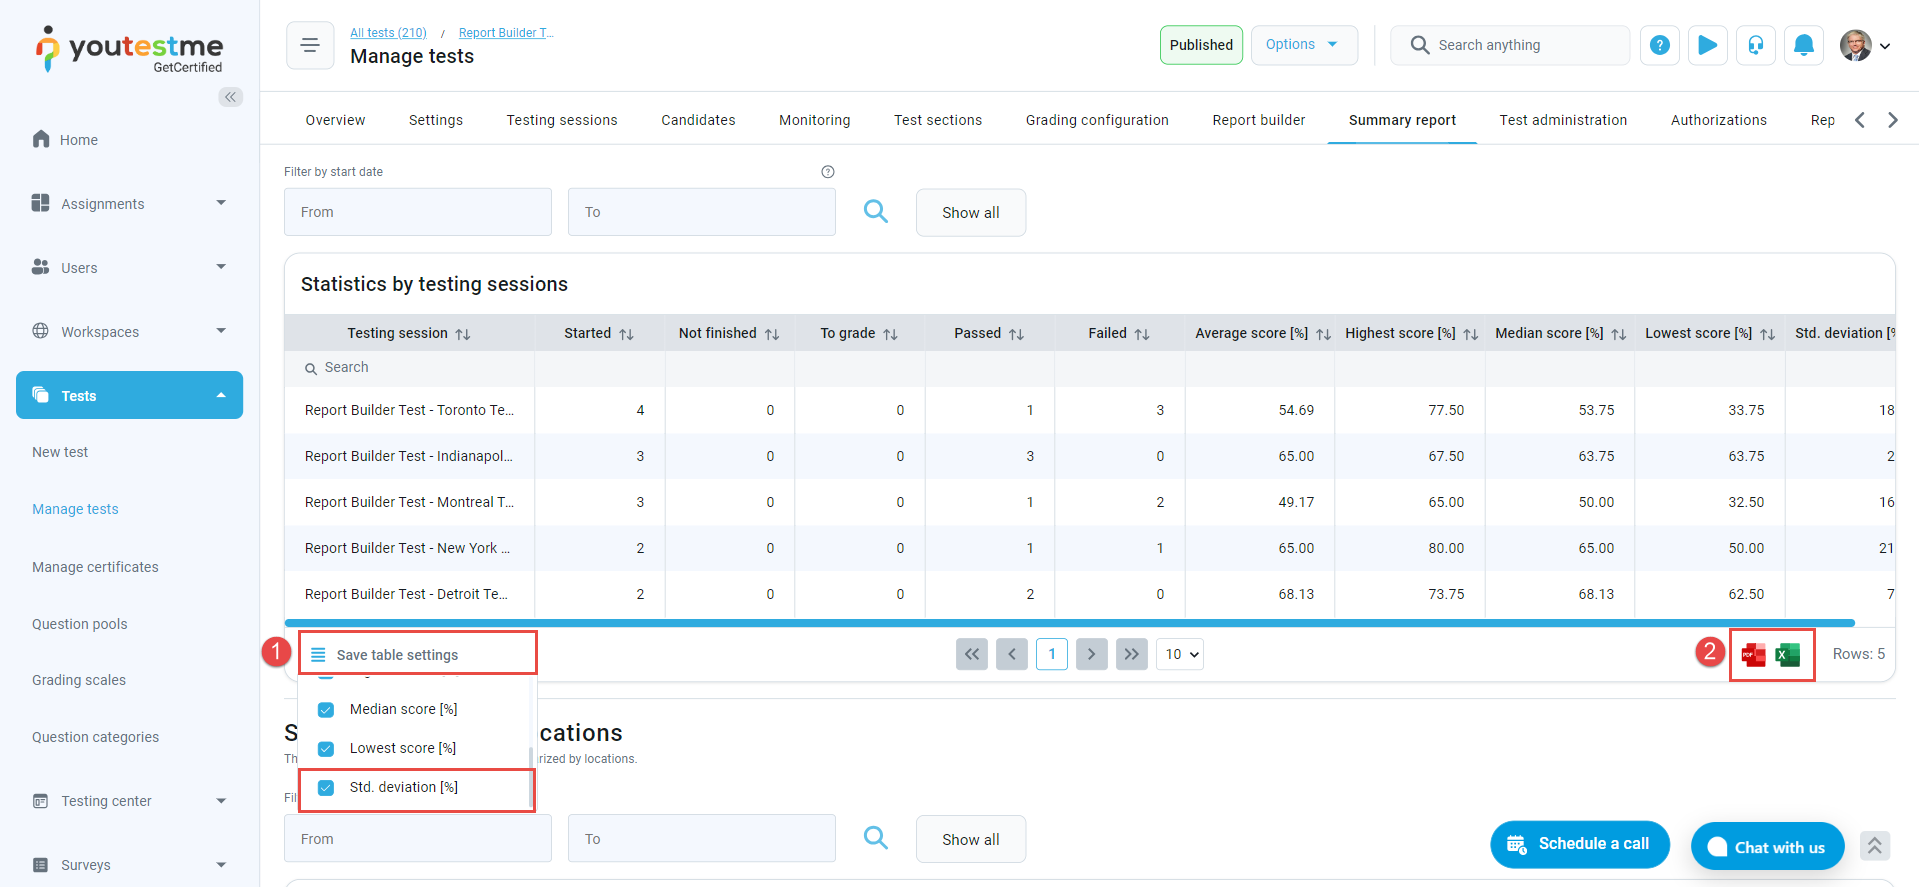
Statistics by Testing Sessions
Alongside the global report, the system generates a statistical report categorized by testing sessions, enabling you to:
- Utilize the filter to select the specific time frame for reviewing the statistics.
- Examine and compare the progress and key statistics for each individual session conducted.
- To select the columns you wish to display or remove from the table, access the hamburger menu labeled Save Table Settings. Then, check or uncheck the boxes next to the column names.
- To download the report in either PDF or Excel format, simply click on the respective icon for your preferred format.
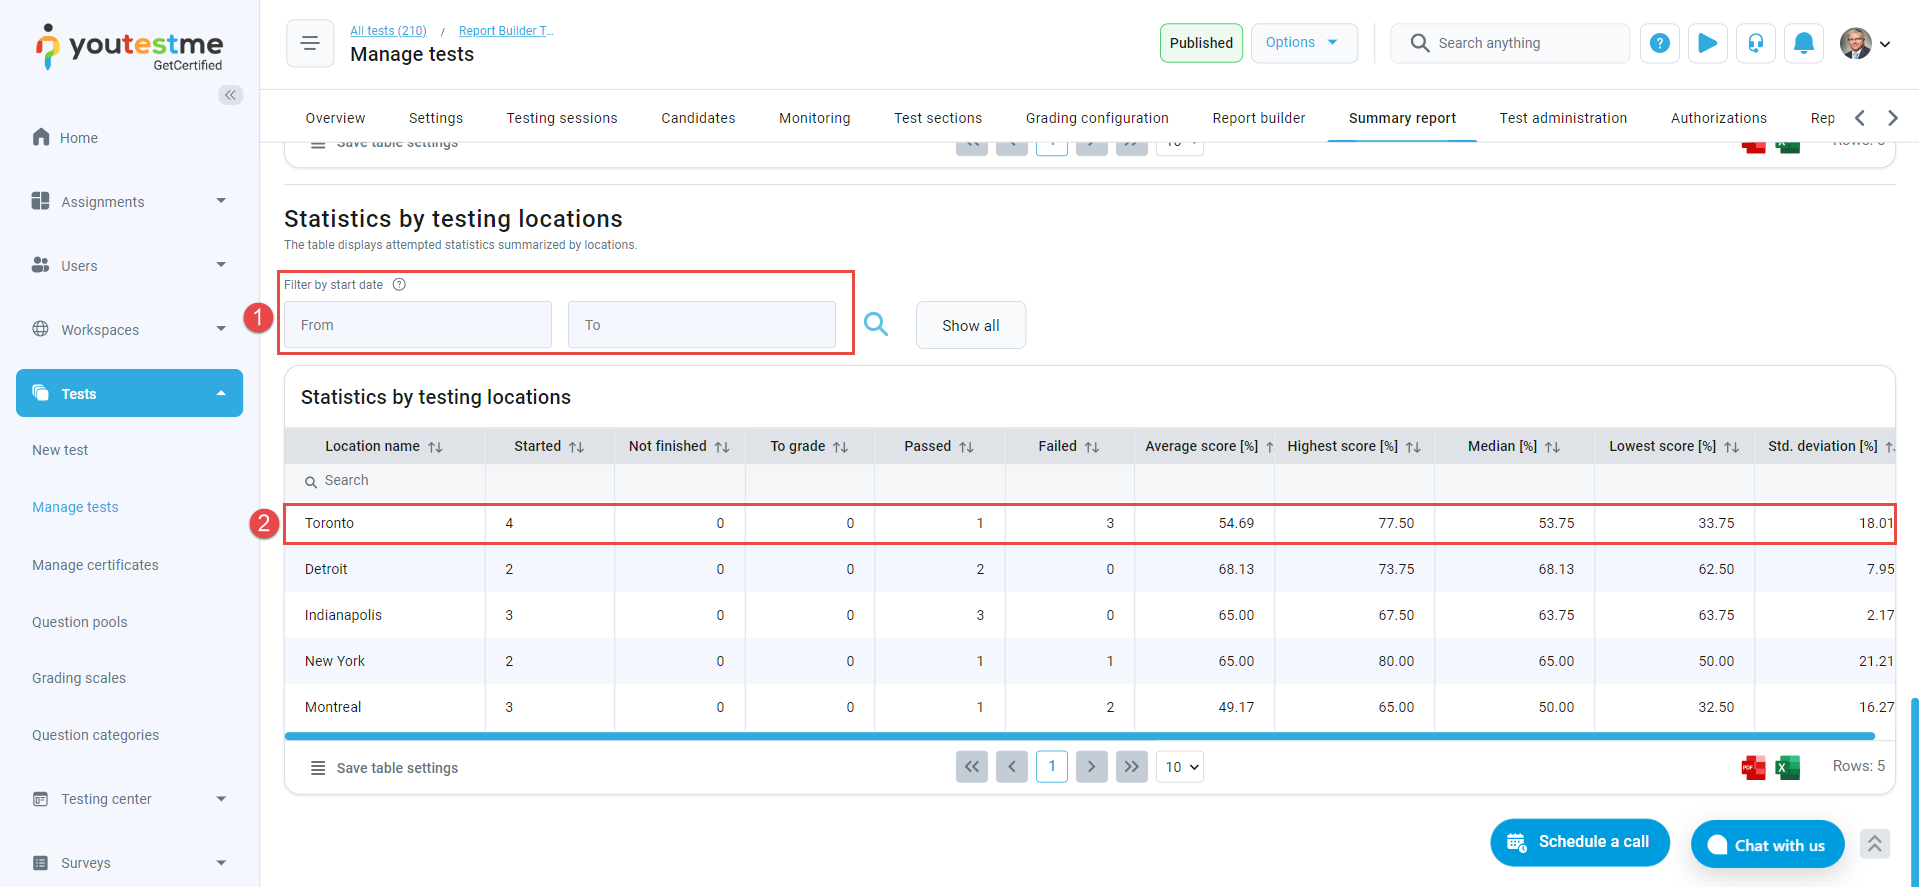
Statistics by Testing Locations
For exams conducted in various locations, the system produces a statistical report segmented by testing locations, providing you with the ability to:
- Select the time frame for reviewing and comparing the statistics.
- Analyze and compare the progress and key statistics for each individual location.
Question-Level Statistic Report
To access the Questions report, please follow these steps:
- In the main menu, go to Tests.
- Then, navigate to Manage tests.
- Click on the name of the desired test and navigate to the Questions tab.
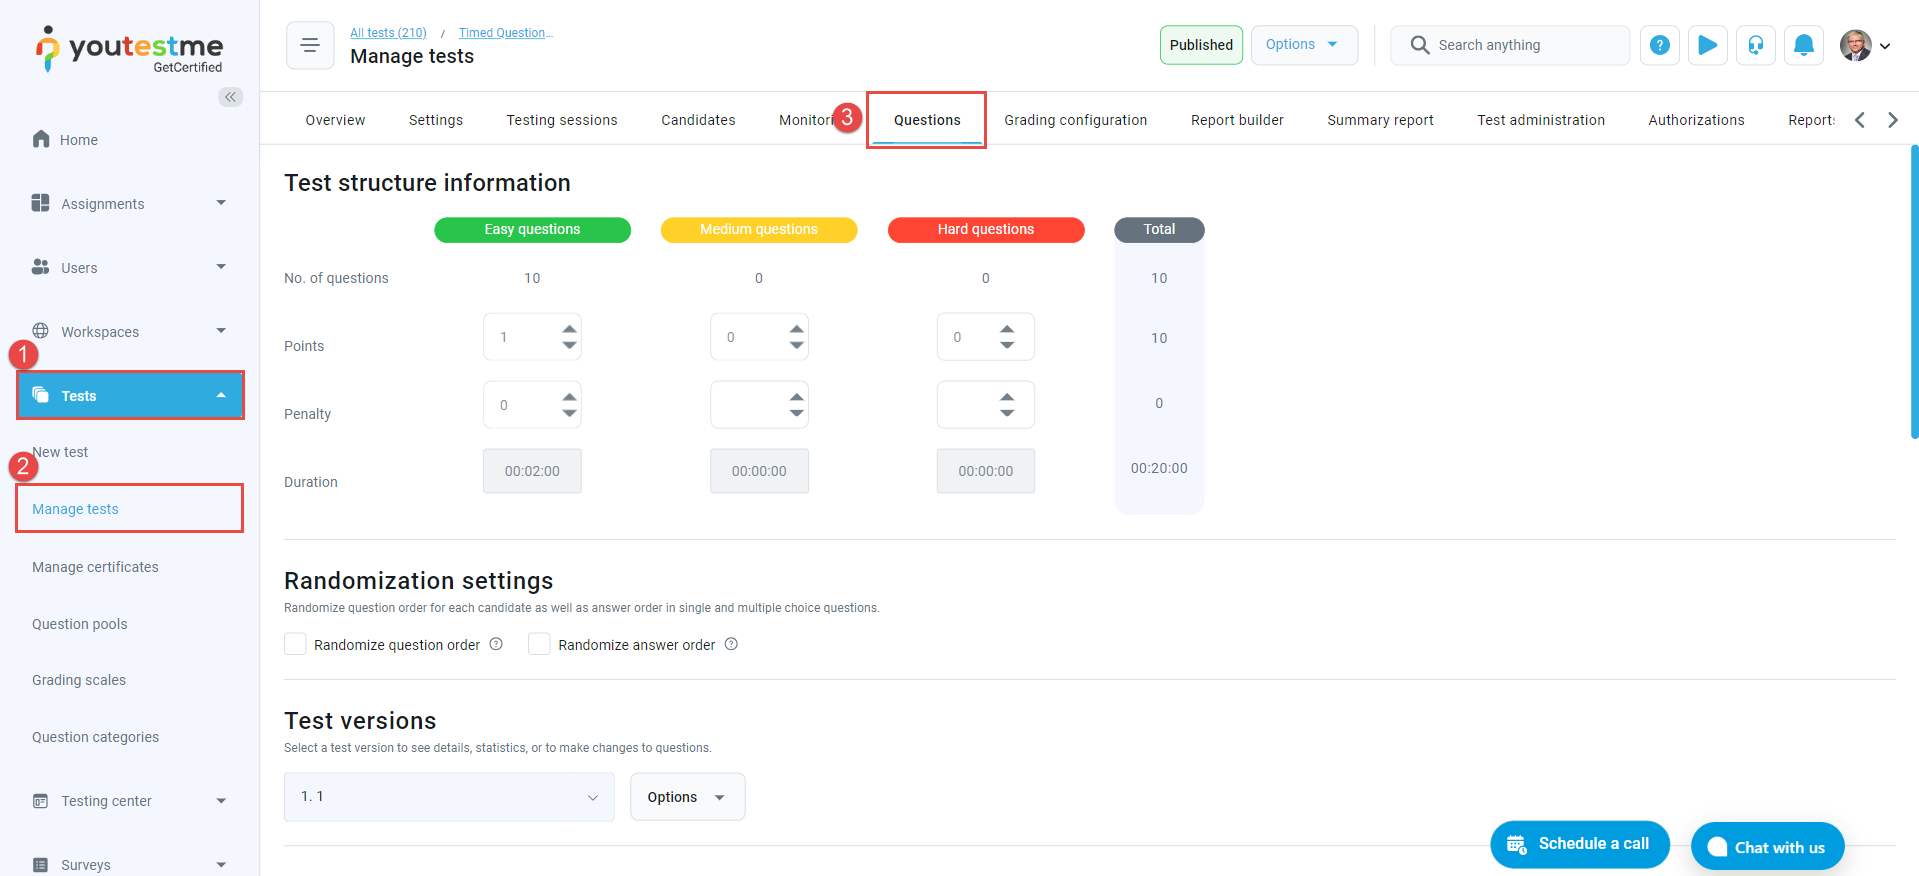
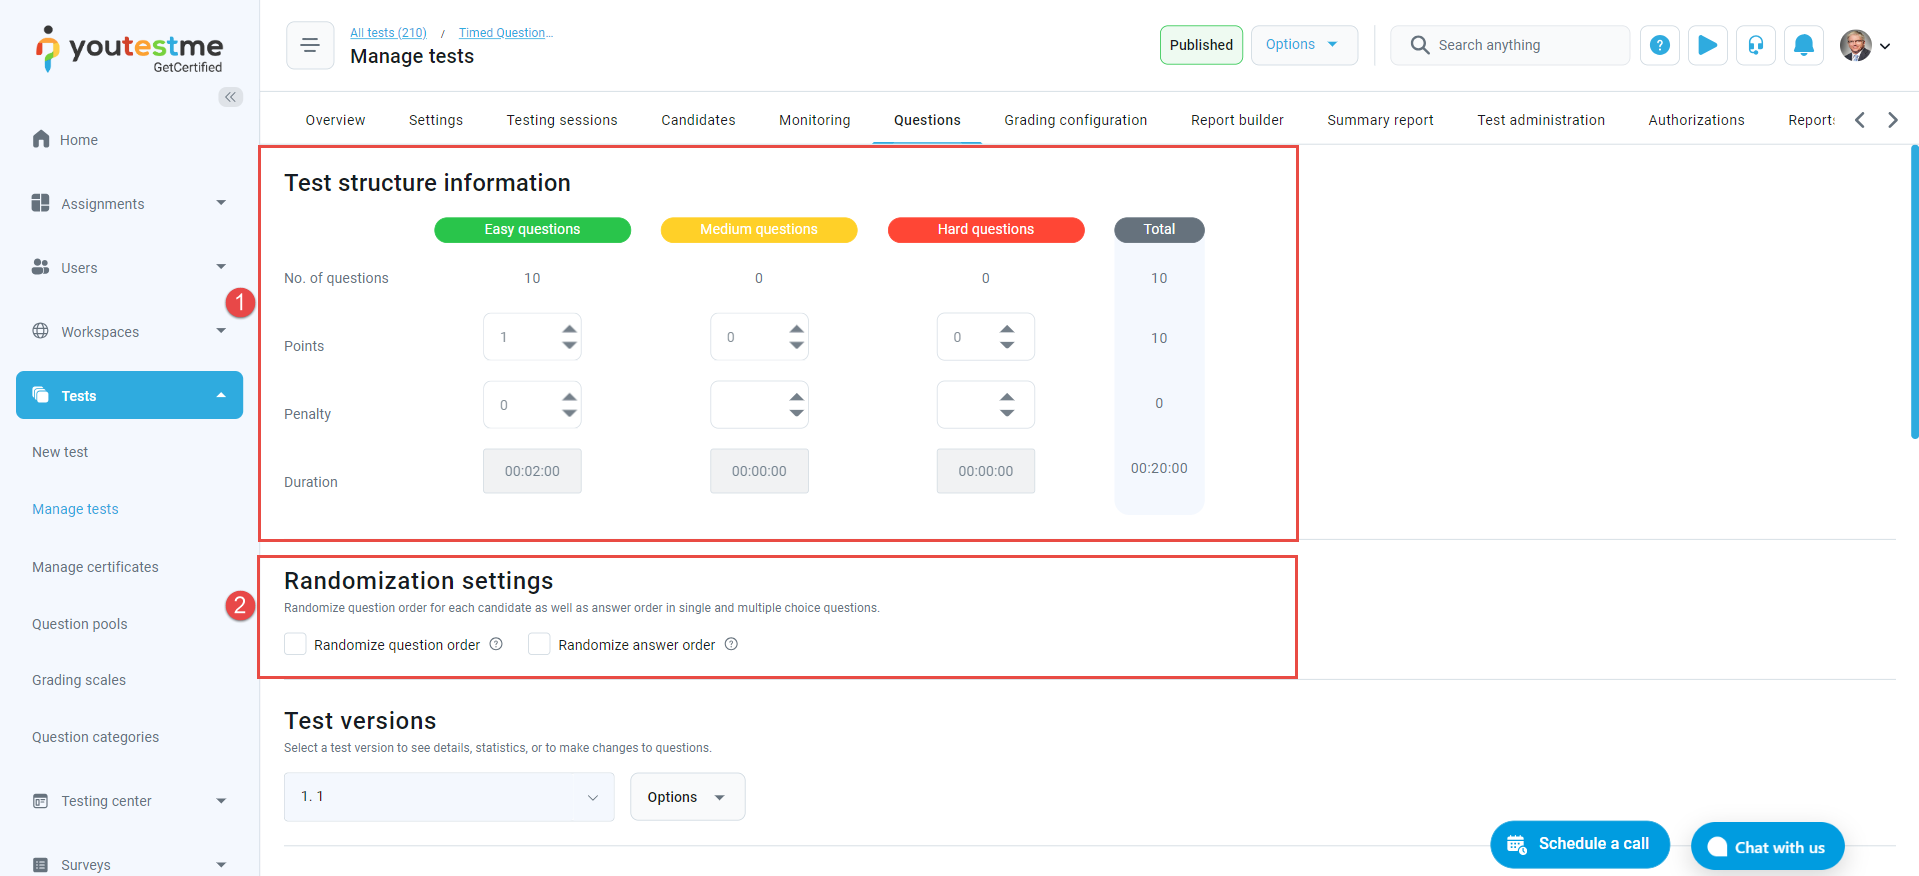
In this tab, you can:
- Access the Test Structure Information, which lets you review the number of questions used in the test for each difficulty level, along with the associated points, penalties, and durations.
- Decide whether to randomize the questions and answers for each candidate.
To compare the performance of candidates for each question used in the test, follow these steps:
- Click the Test Versions drop-down menu and select the desired test version.
- Click on Compare Questions By and choose the parameter you want to use for comparison (Success Ratio, Time to Answer, or Question Occurrence).
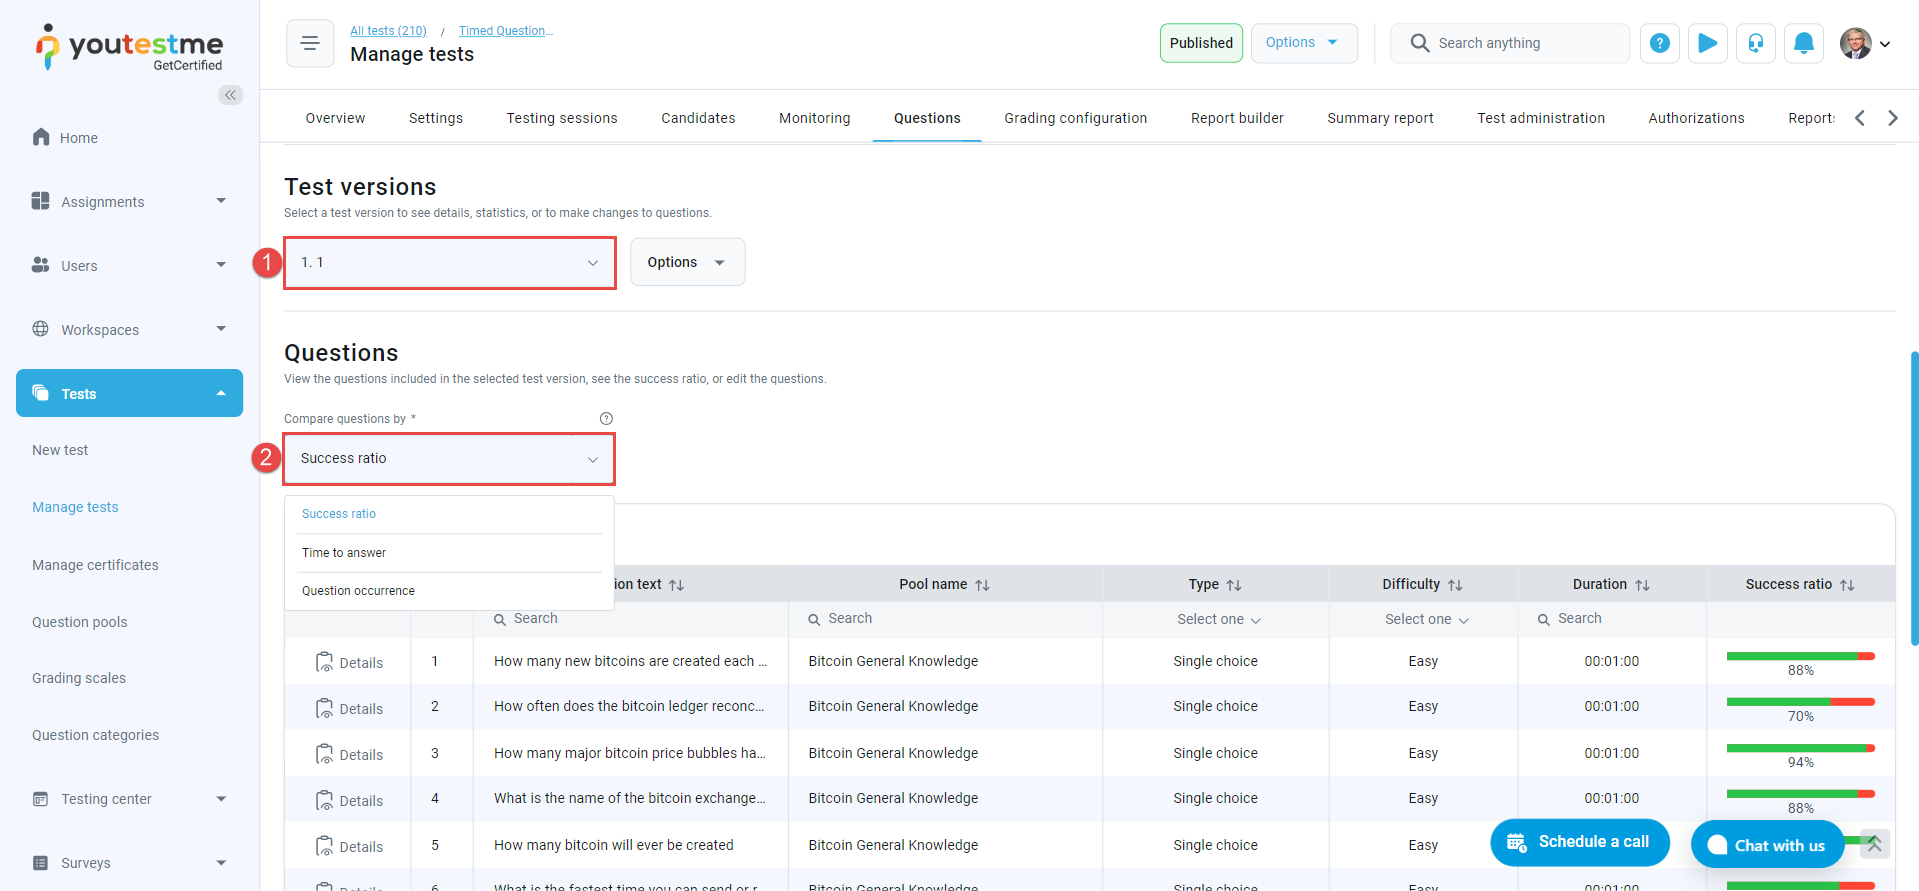
The Questions table will present the selected data alongside the question details, including difficulty, duration, type, and pool name.
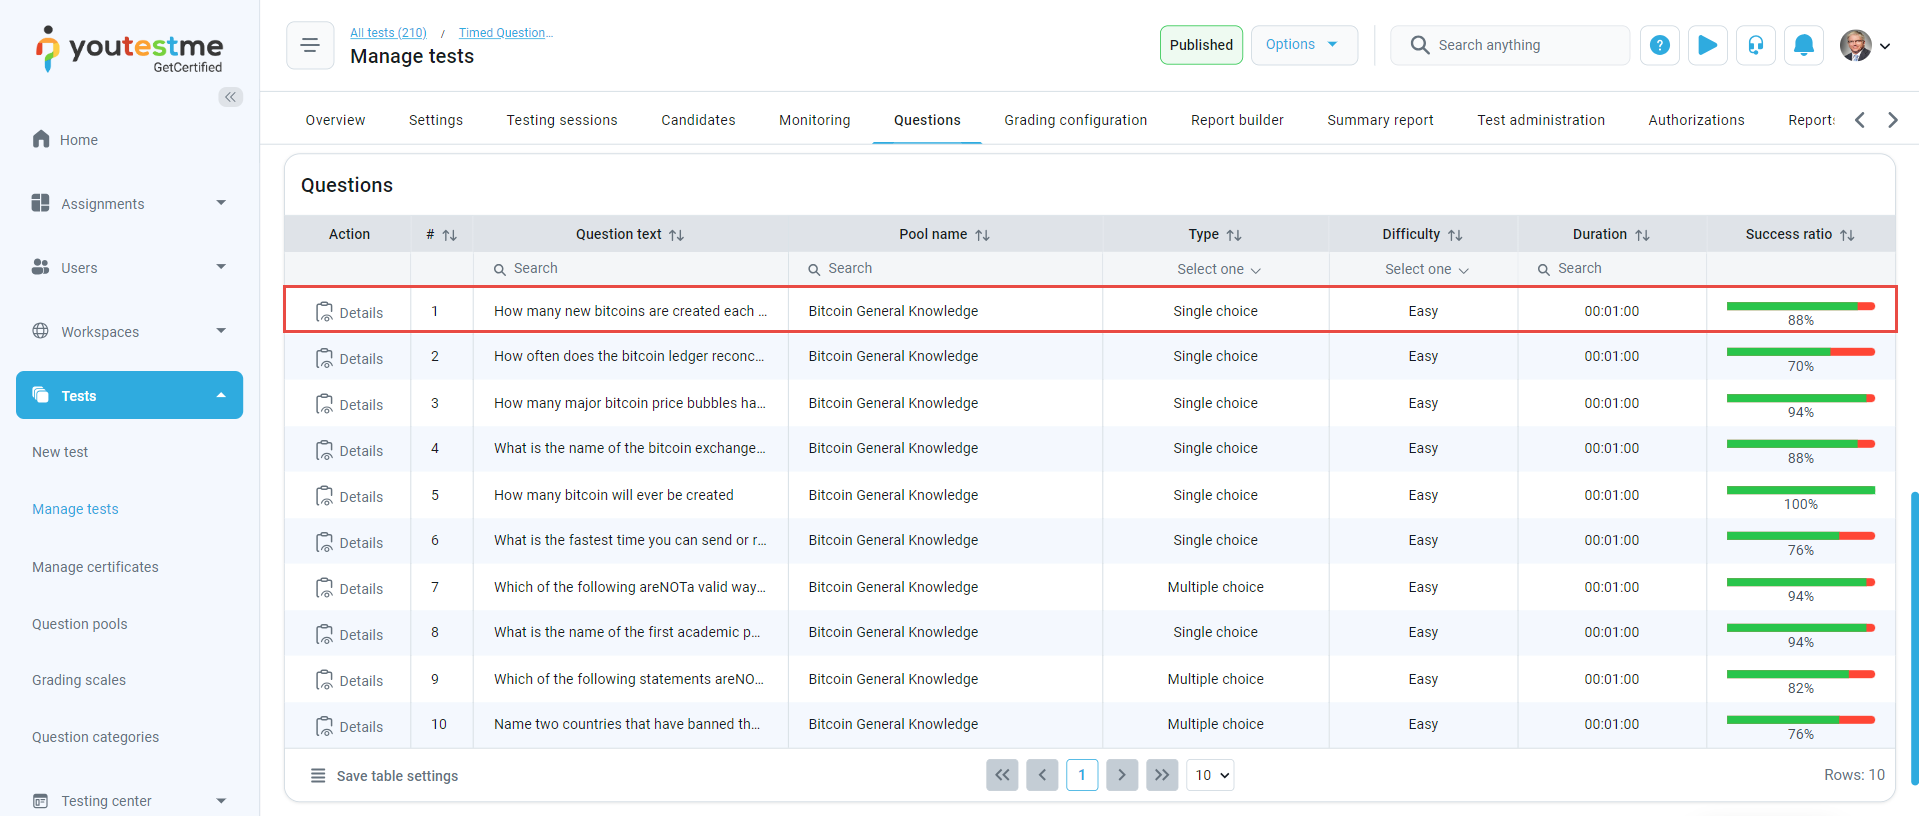
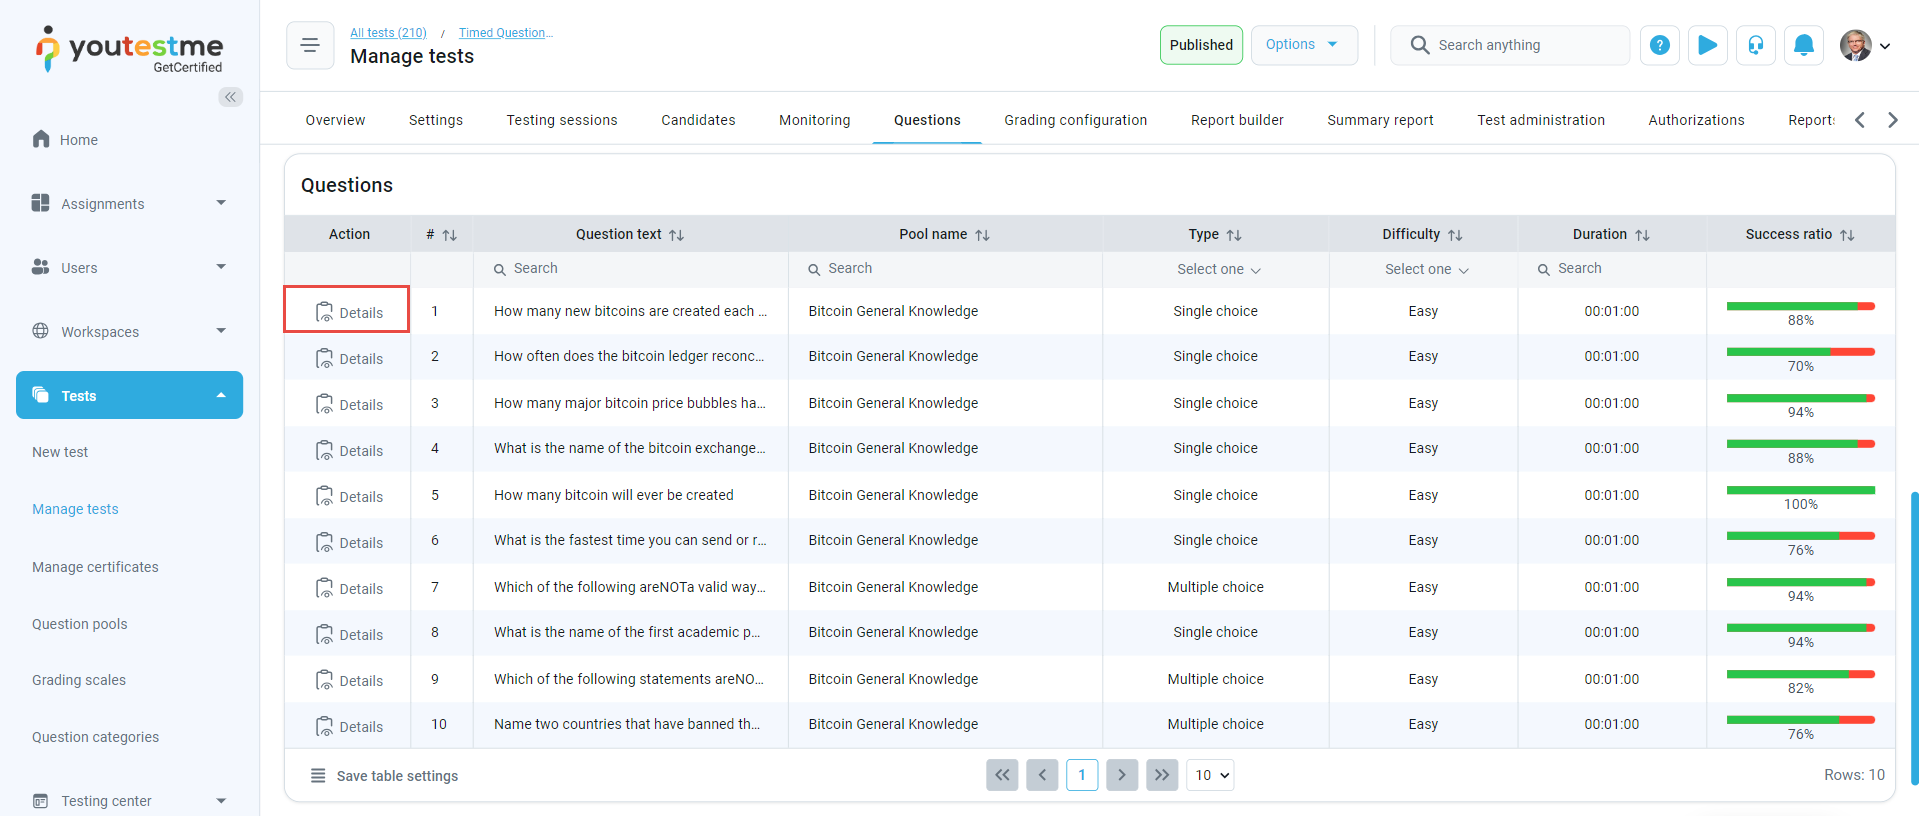
Moreover, you can preview the statistics for each answer to analyze the quality of the answers.
To examine the statistics for question answers related to a specific question, click on the Details button.
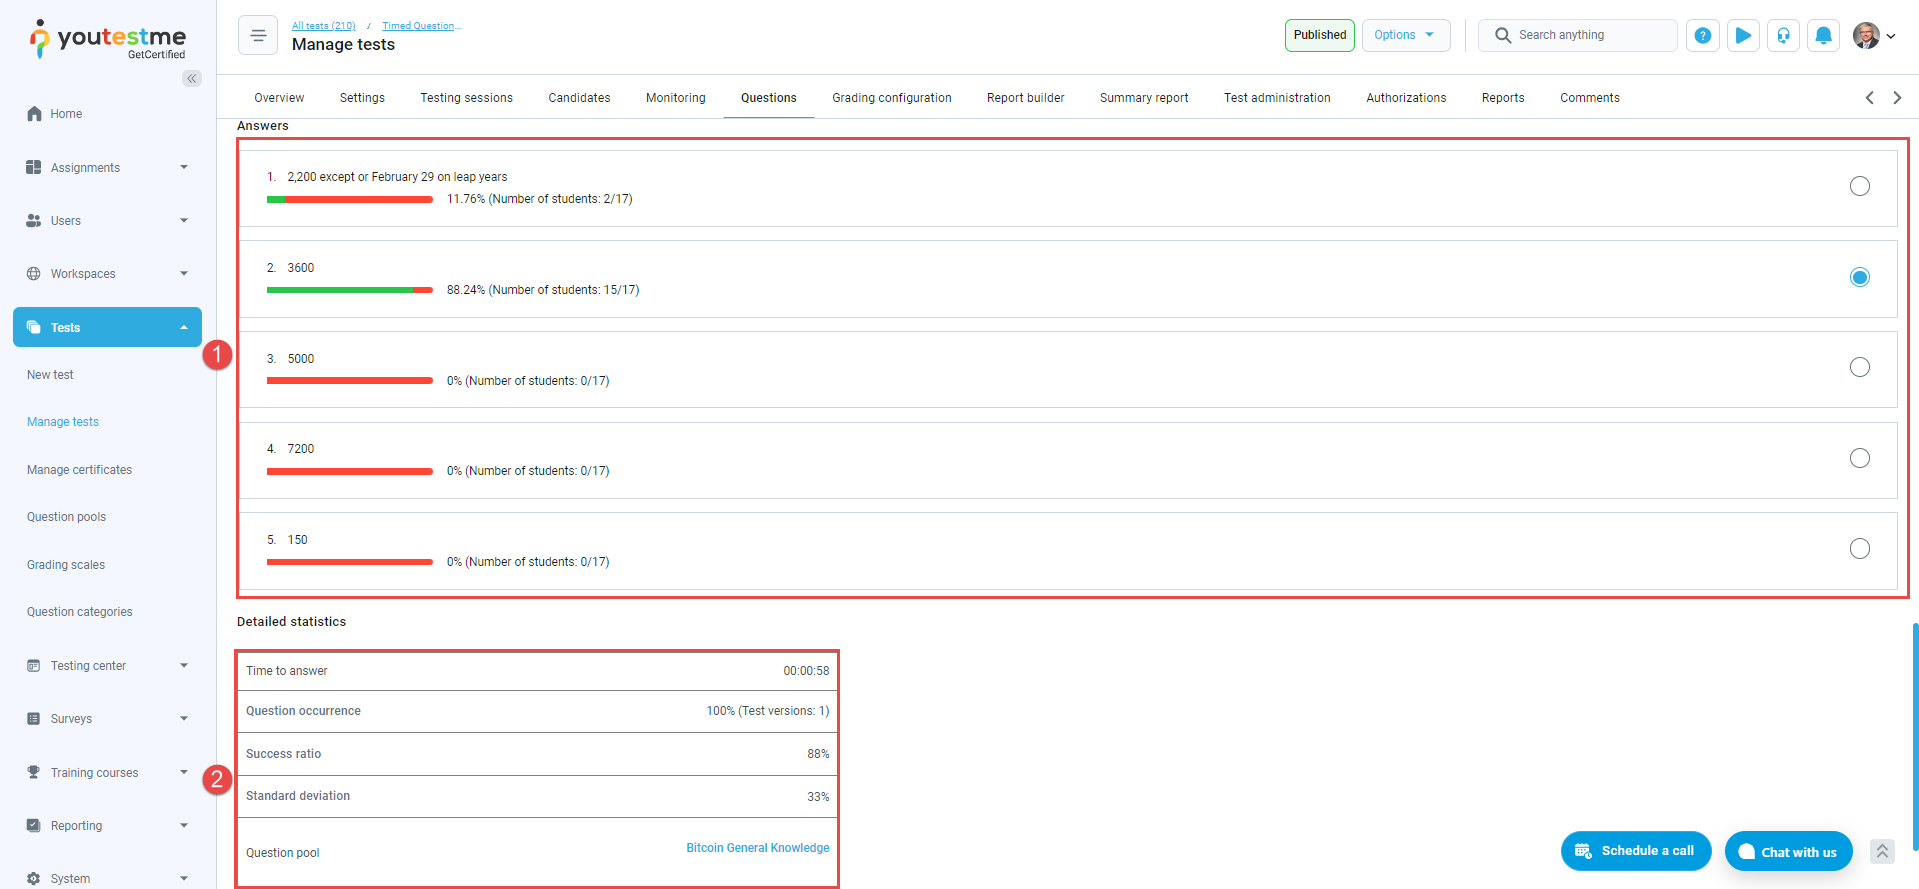
The Answers Report provides the following information:
- The percentage and number of candidates who selected each answer.
- Global statistics for the question, including the success ratio and the standard deviation.
For more related instructional materials, please see: