
Article verified for Release 15.2 on February 24, 2026.
This article explains how to access and review statistics on questions in a selected question pool. Reports include candidate performance metrics and graphical breakdowns of question types and difficulty levels.
Accessing the question pool
To open the reports:
- Hover over Tests in the main menu.
- Select the Question pools page.
- Click the name of the desired question pool.
- Open the Reports tab.

Question Statistics Report
Select Question Statistics and click Show.
This report provides detailed statistics on how candidates performed on each question in the selected pool.
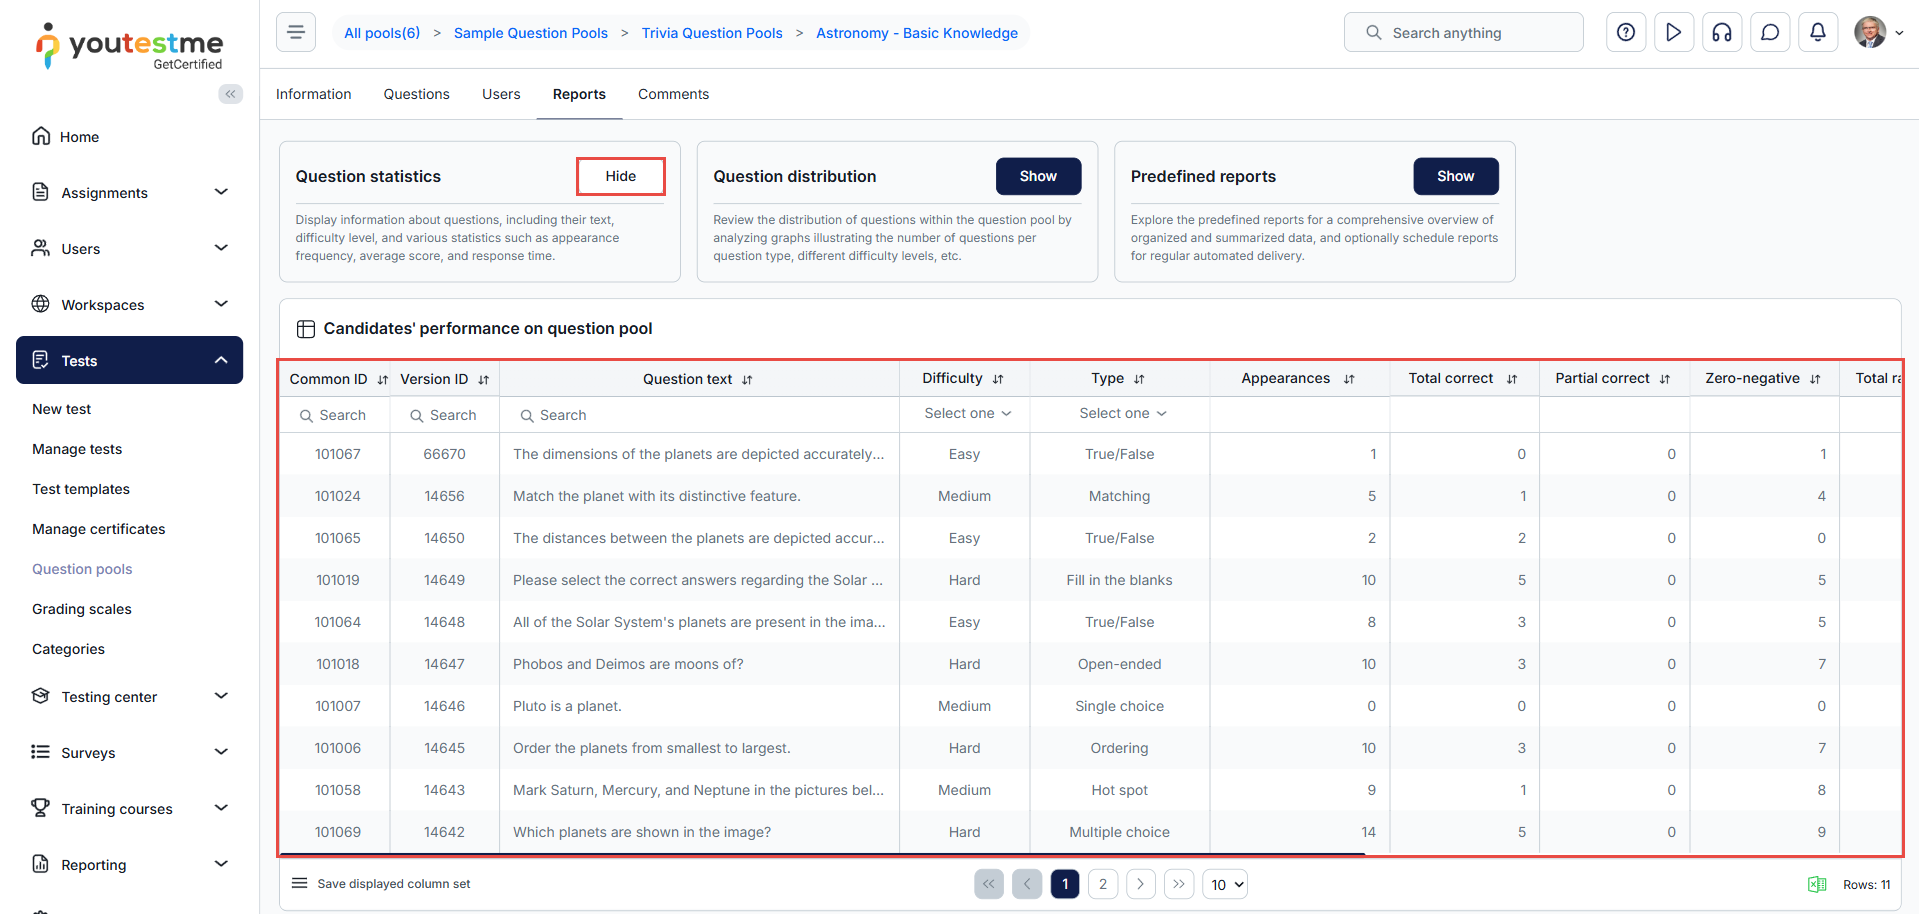
Candidates’ performance on the question pool
The Candidates’ performance on the question pool is a table of basic statistics of questions that shows the candidates’ performance and basic information about the questions. These statistics and data include the following:
- The ID represents the question ID in the system.
- The Question text is the question content.
- The Difficulty represents the question’s difficulty level. It can be easy, medium, or hard.
- The Type is the question type. It can be a single-choice question, multiple-choice question, essay question, ordering question, fill-in-the-blanks question, true/false question, etc.
- The Appearance is the number of times the question occurred in all tests in the system.
- The Total correct is the number of correct answers to the question in all tests in which the question occurs.
- The Partial correct is the number of answers to the question with points between zero and the maximum possible points in all tests in which the question occurs.
- The Zero-negative is the number of answers to the question on which zero or fewer points were achieved in all tests on which the question appears.
- The Total ratio is the ratio of the Total correct and Appearances columns in percent.
- The Partial ratio is the ratio of Partial correct and Appearances columns in percent.
- The Negative ratio is the ratio of Zero-negative and Appearance columns in percent.
- The Average percent is the average percentage of points scored on the question.
- The Average time is the average time the candidates spent answering the question.
Question Distribution Report
Select Question Distribution and click Show.
This report provides visual graphs illustrating the composition of questions in the selected pool. It helps managers quickly assess the balance of question difficulty, type, and topic coverage.
The report includes:
- Number of questions by difficulty
The Number of questions by difficulty is a graph of the distribution of questions in the selected pool. It displays the number of questions for each difficulty level (Easy, Medium, Hard). - Number of questions by type
The Number of questions by type is a graph of the distribution of questions by type in the selected pool. It displays the number of questions for each question format (e.g., Multiple Choice, Essay, True/False). - Number of questions by values of Topic
The Number of questions by values of Topic displays the number of questions in the pool grouped by the different custom property Topic values.

Predefined Reports
Select Predefined Reports to access more detailed analytical reports.
These include advanced insights on question performance, usage frequency, and trends across different tests.
For detailed instructions on working with these reports, visit Predefined reports.

For more related instructional materials, please visit: