
Article verified for Release 15.0 on September 8, 2025.
This article explains how to effectively examine and compare test scores at multiple levels – the test itself, individual user performance, and group-level analysis. Whether you need to perform candidate selection after skills testing or require group-level analyses for election preparations, you’ll find valuable insights here.
Locate the Report
To access the Pool Statistics report, follow these steps:
- Navigate to the Manage Tests sub-menu and select the desired test for which you want to analyse the pool reports
- Navigate to the Reports tab.
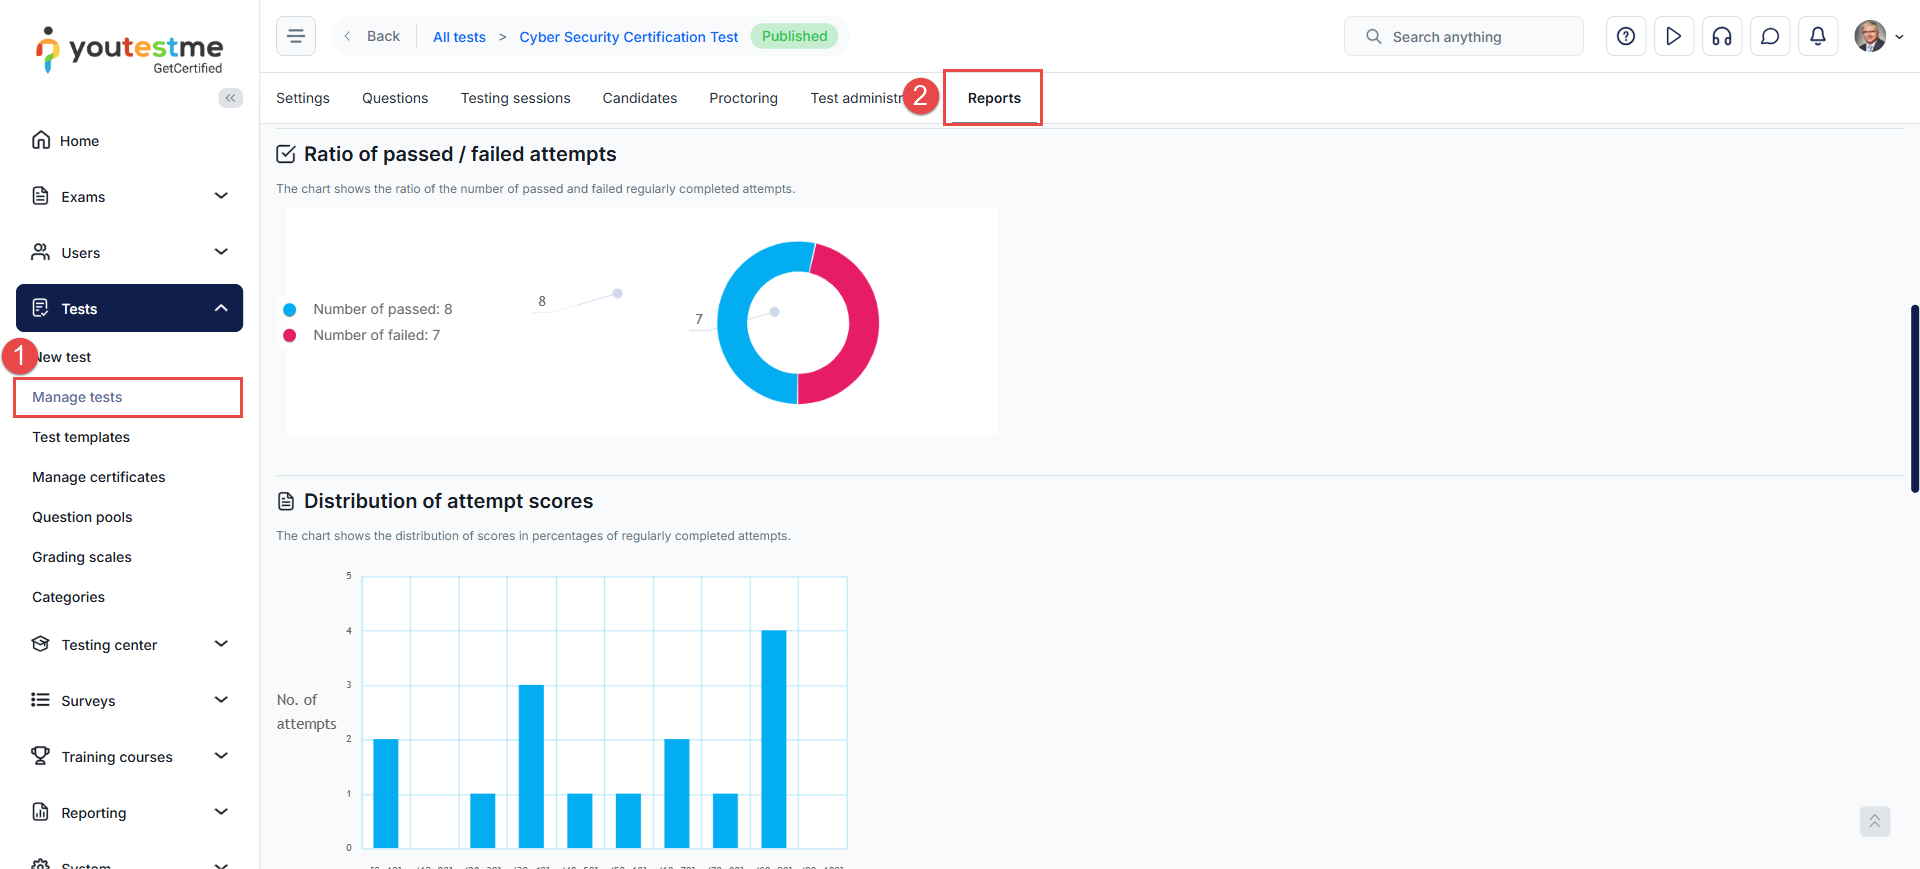
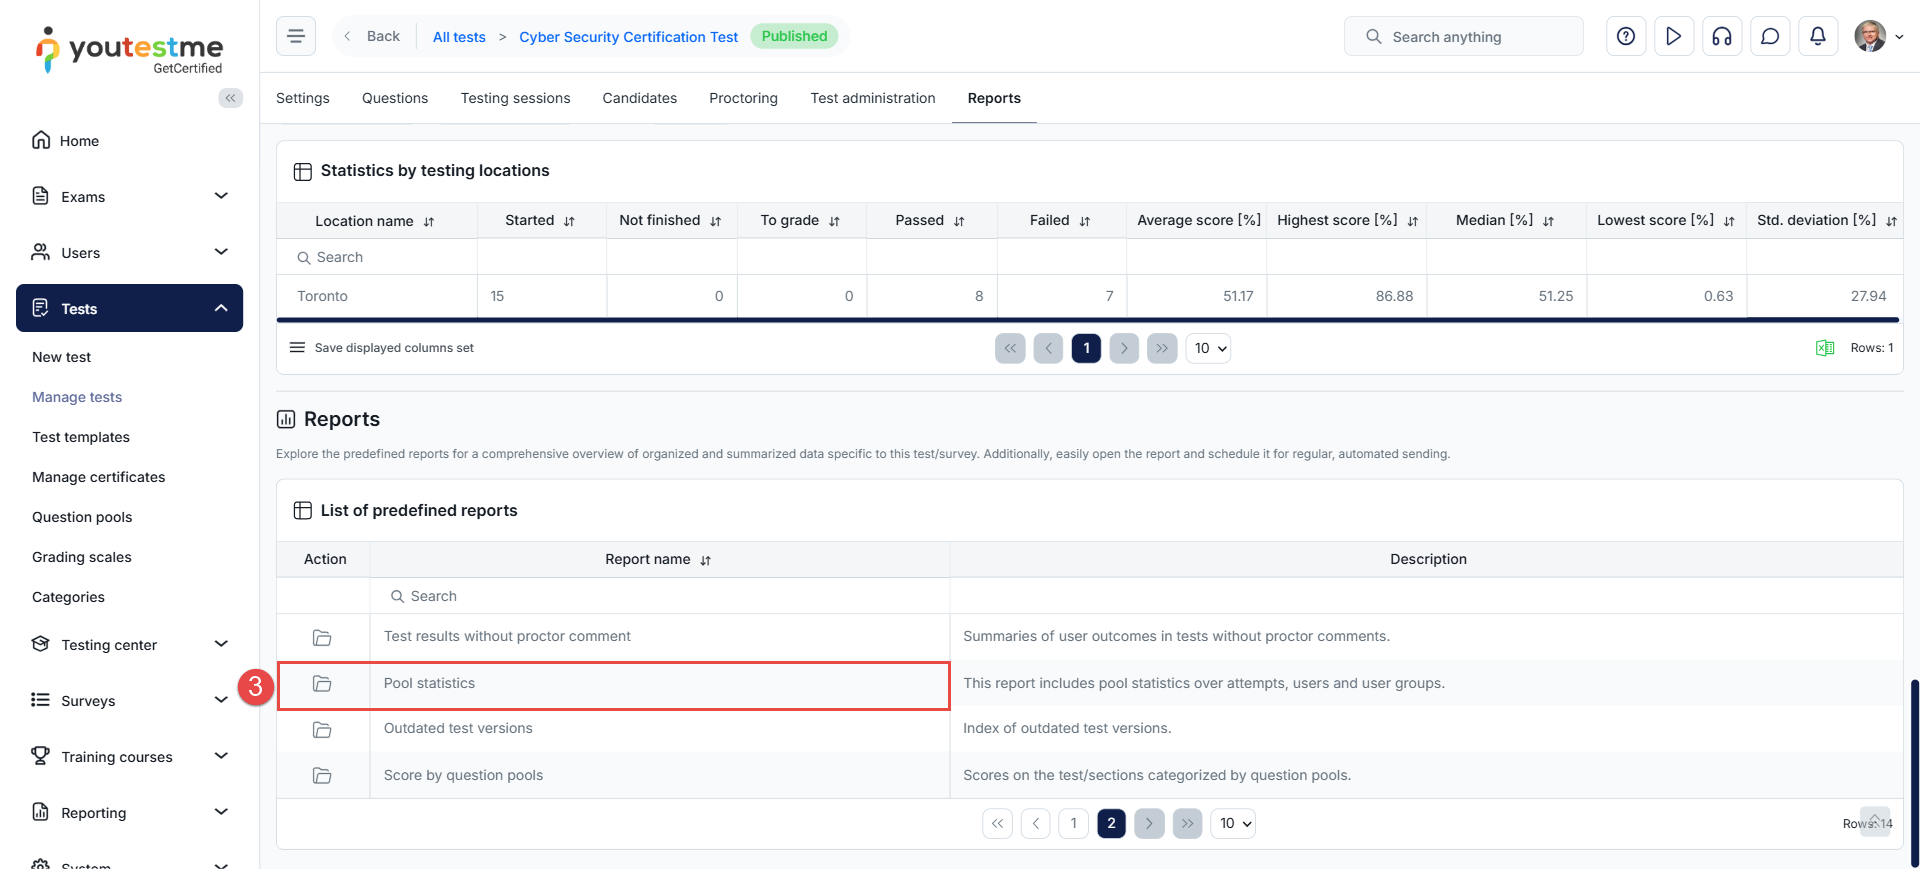
- Scroll to the list of predefined reports and click the Pool Statistics report
Analyzing the Pool Statistics on the Test Level
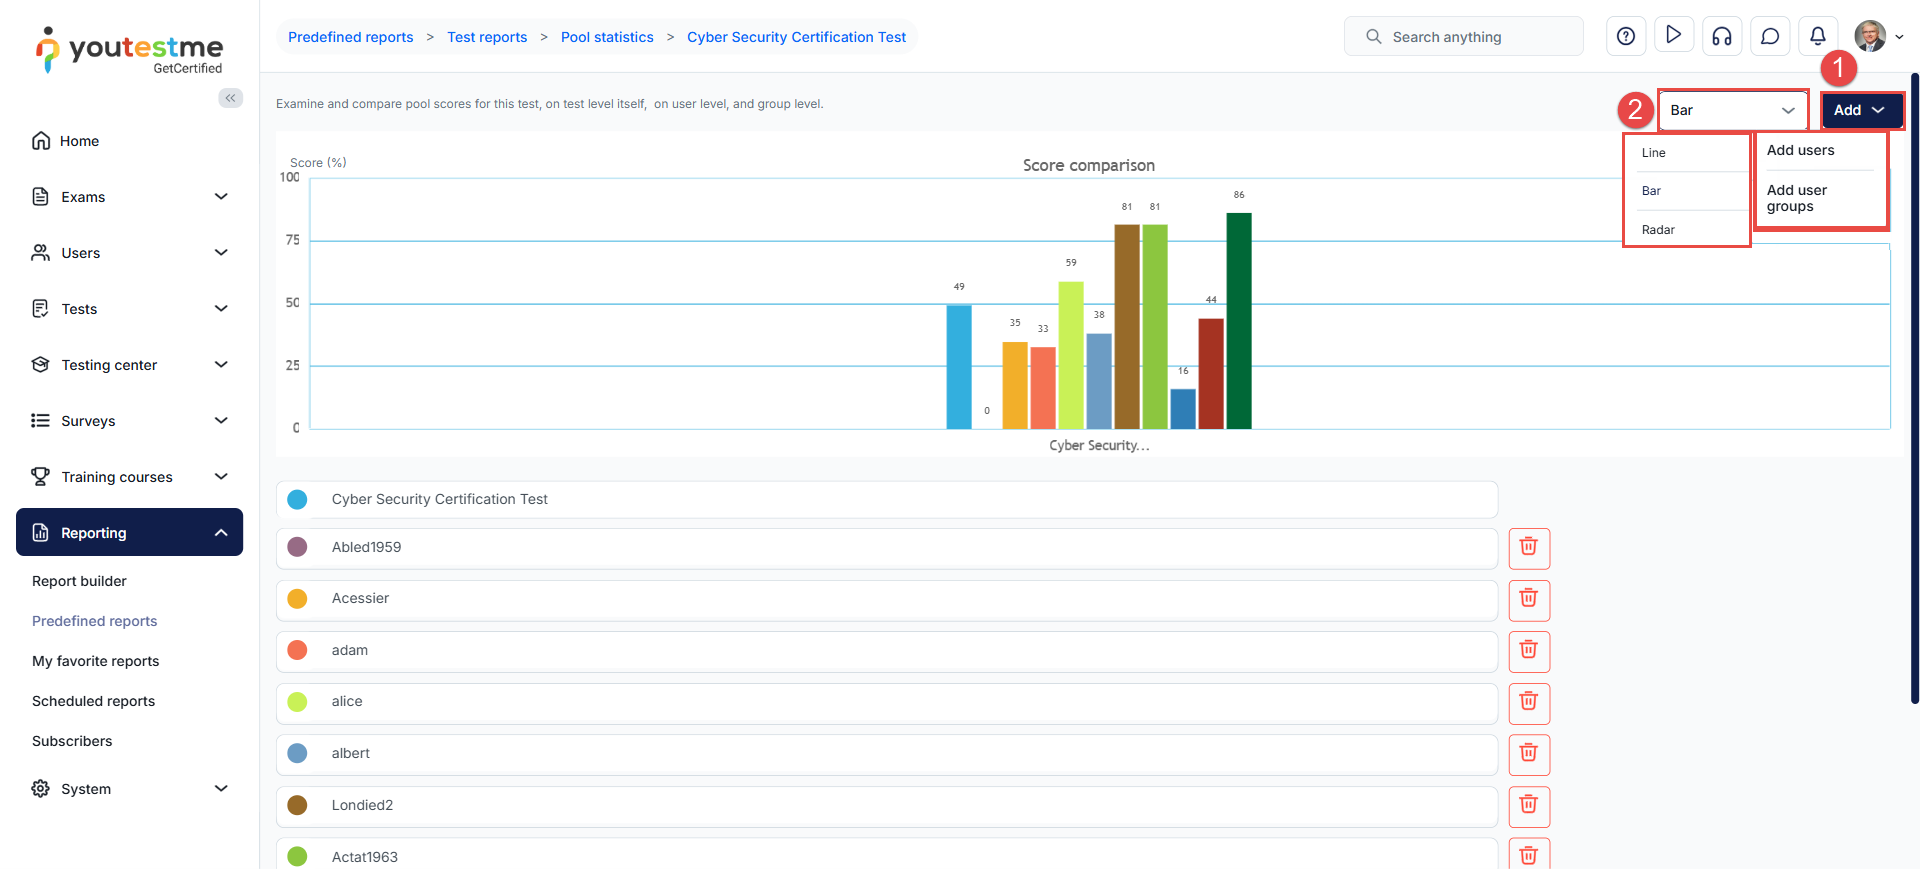
When you open the report, you will immediately view a chart comparing question pools and average scores based on all completed test attempts.
The Pool Statistics report allows you:
- Add users or user groups to compare the achieved scores between users or user groups
- To select the report type, which can be a line, bar, or radar.
Pool Statistics by Users
Adding Users
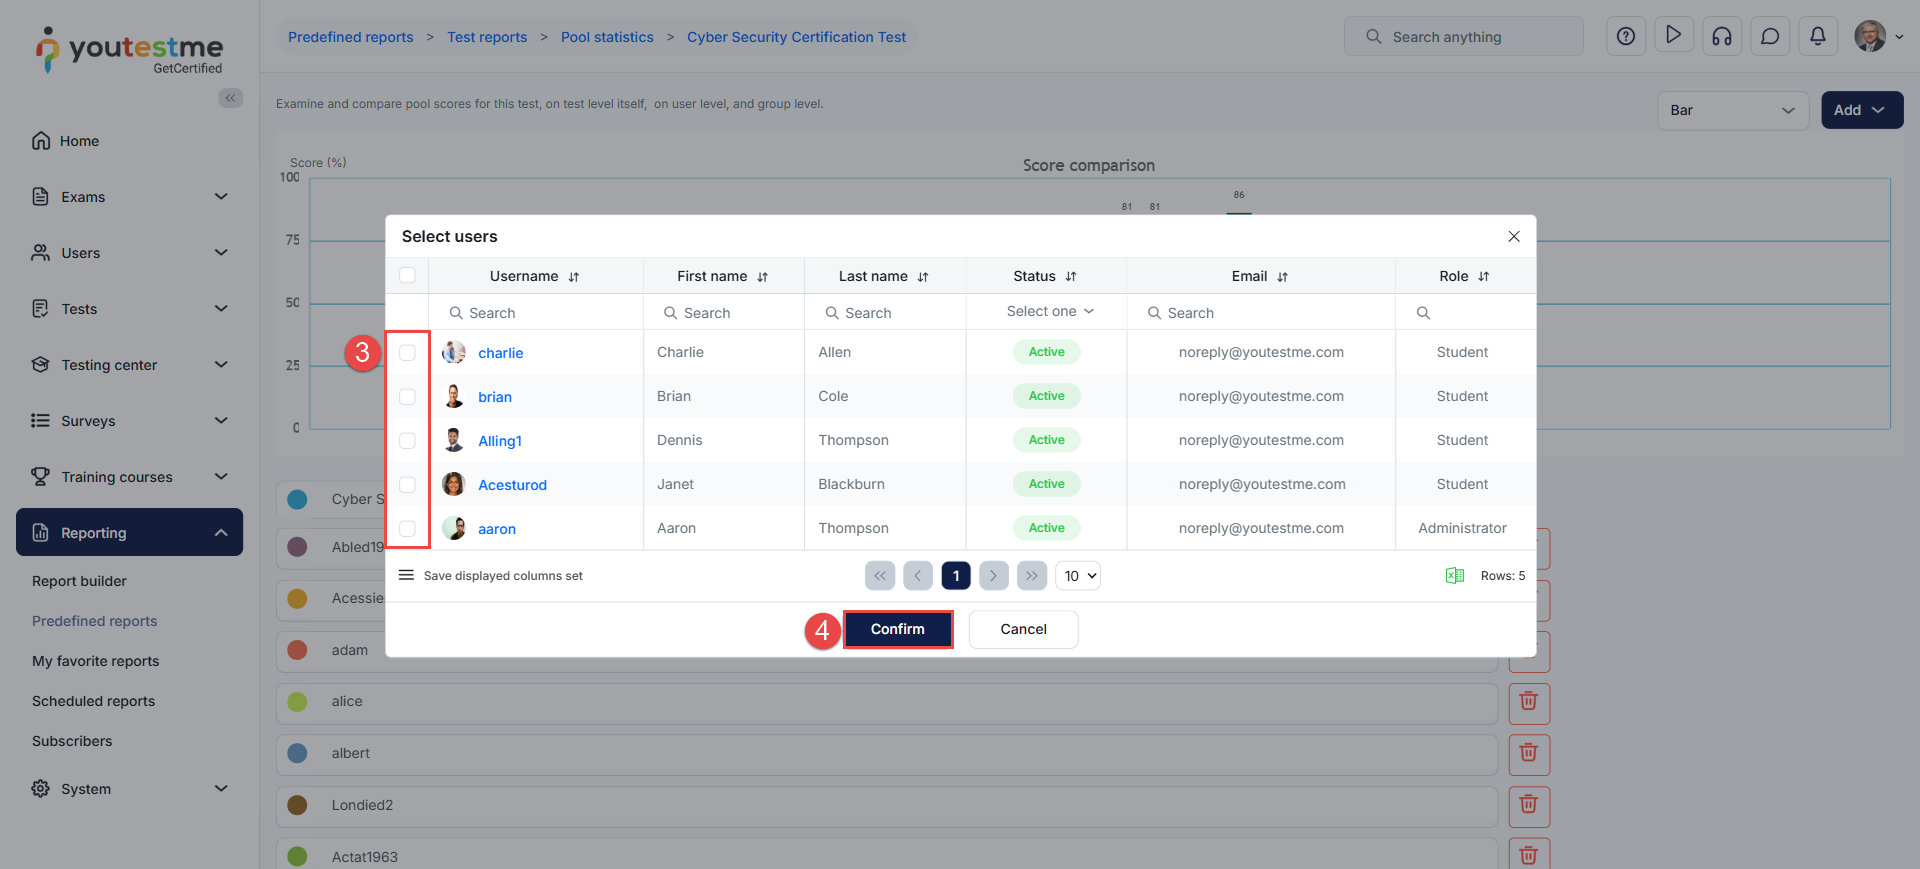
To add your desired users to the statistics, follow these steps:
- Click on the Add button.
- Select Add users.
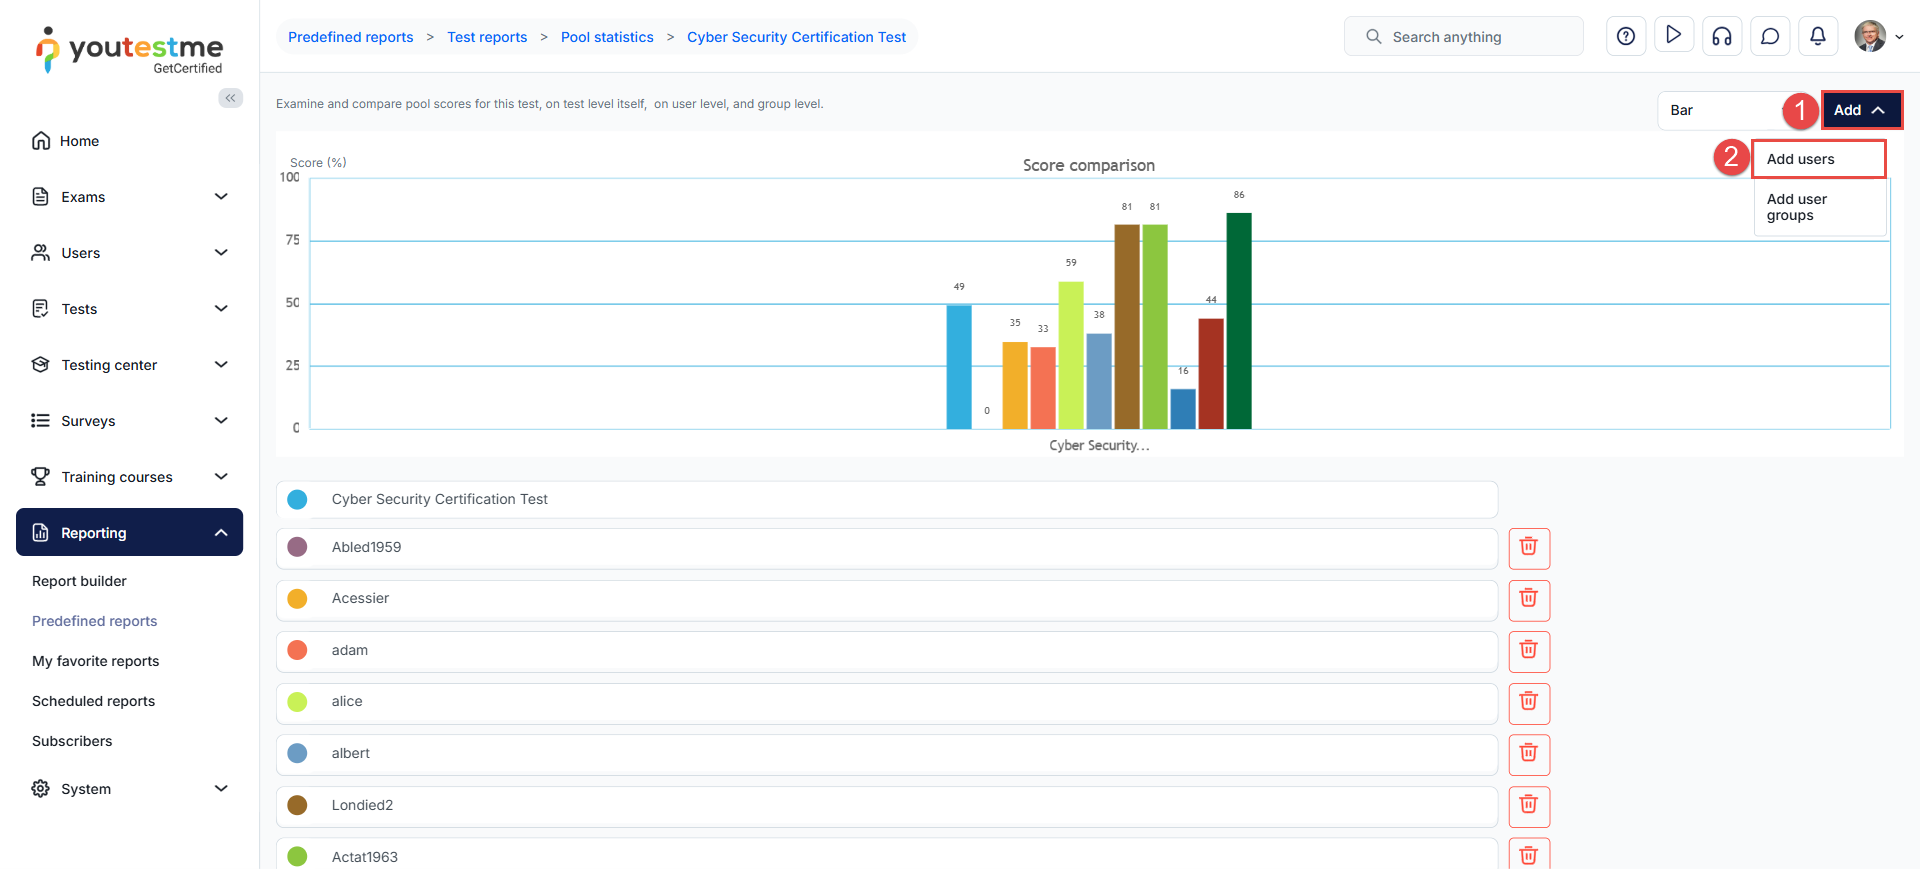
- When the pop-up window appears, choose your desired users.
- Click the Confirm button to save the changes.
Preview of User Statistics
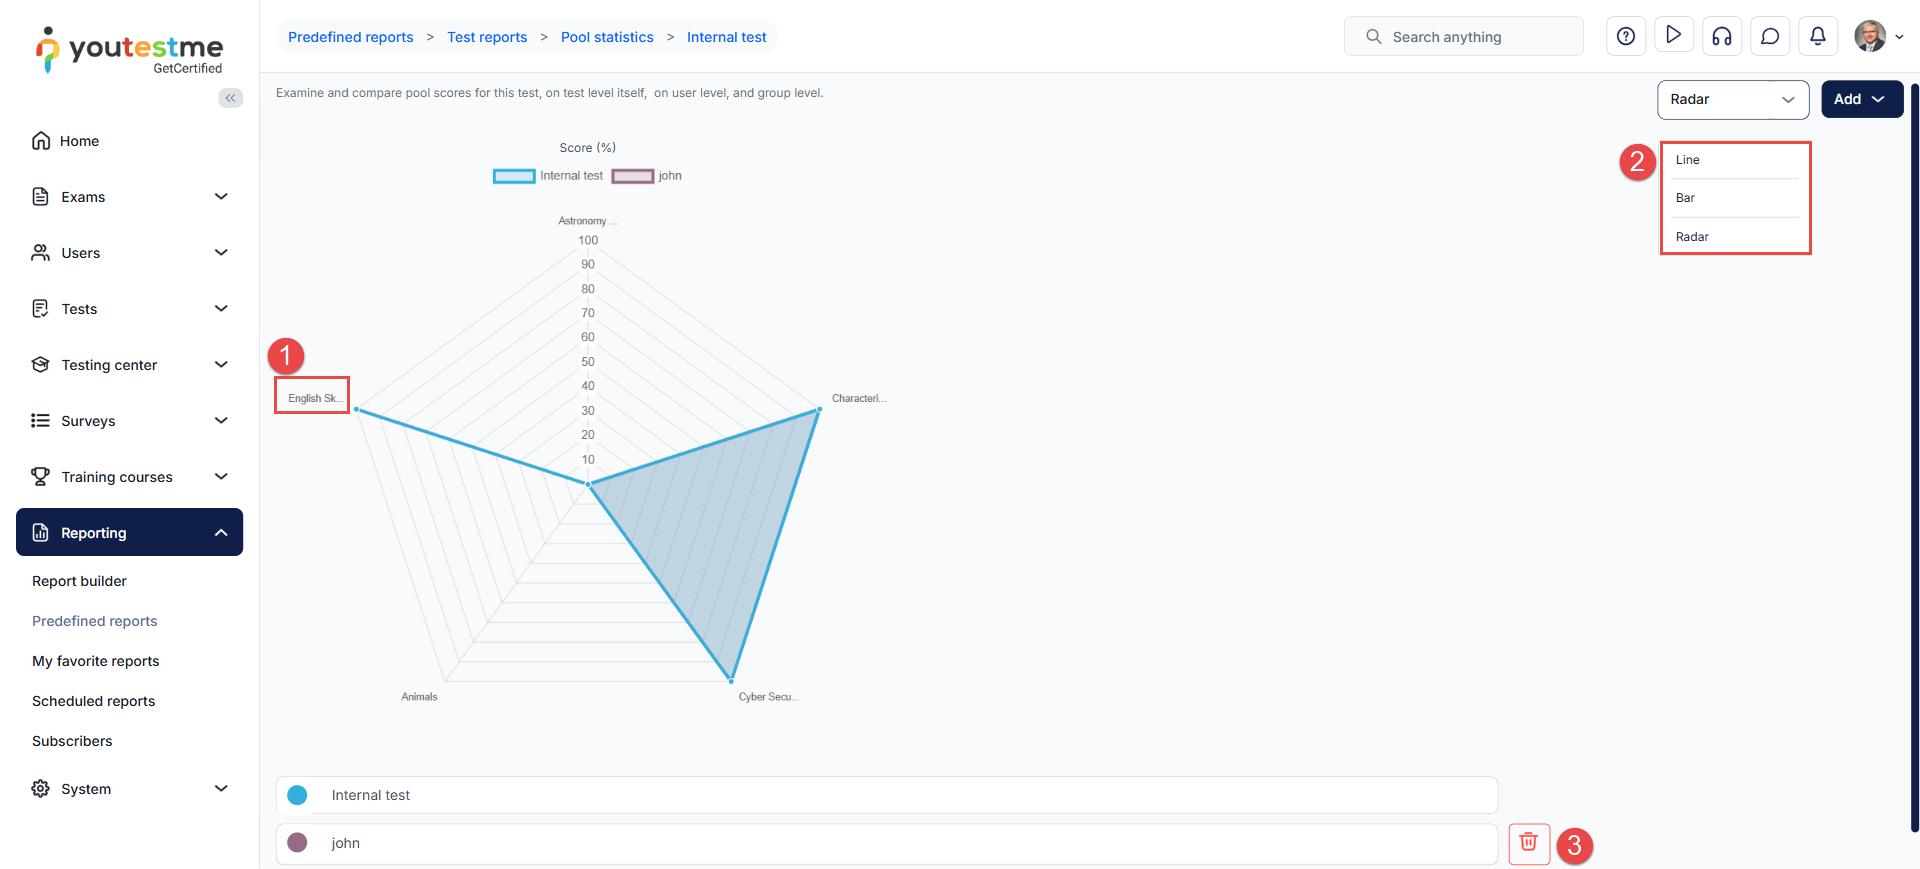
In our example, we have added one candidate:
- On the chart, the performance of the candidate we’ve added is now displayed for each question pool.
- We can change the chart view; in our case, we’ve selected the Radar display.
- We also have the option to remove a candidate from the analysis.
Pool Statistics by User Groups
Adding User Groups
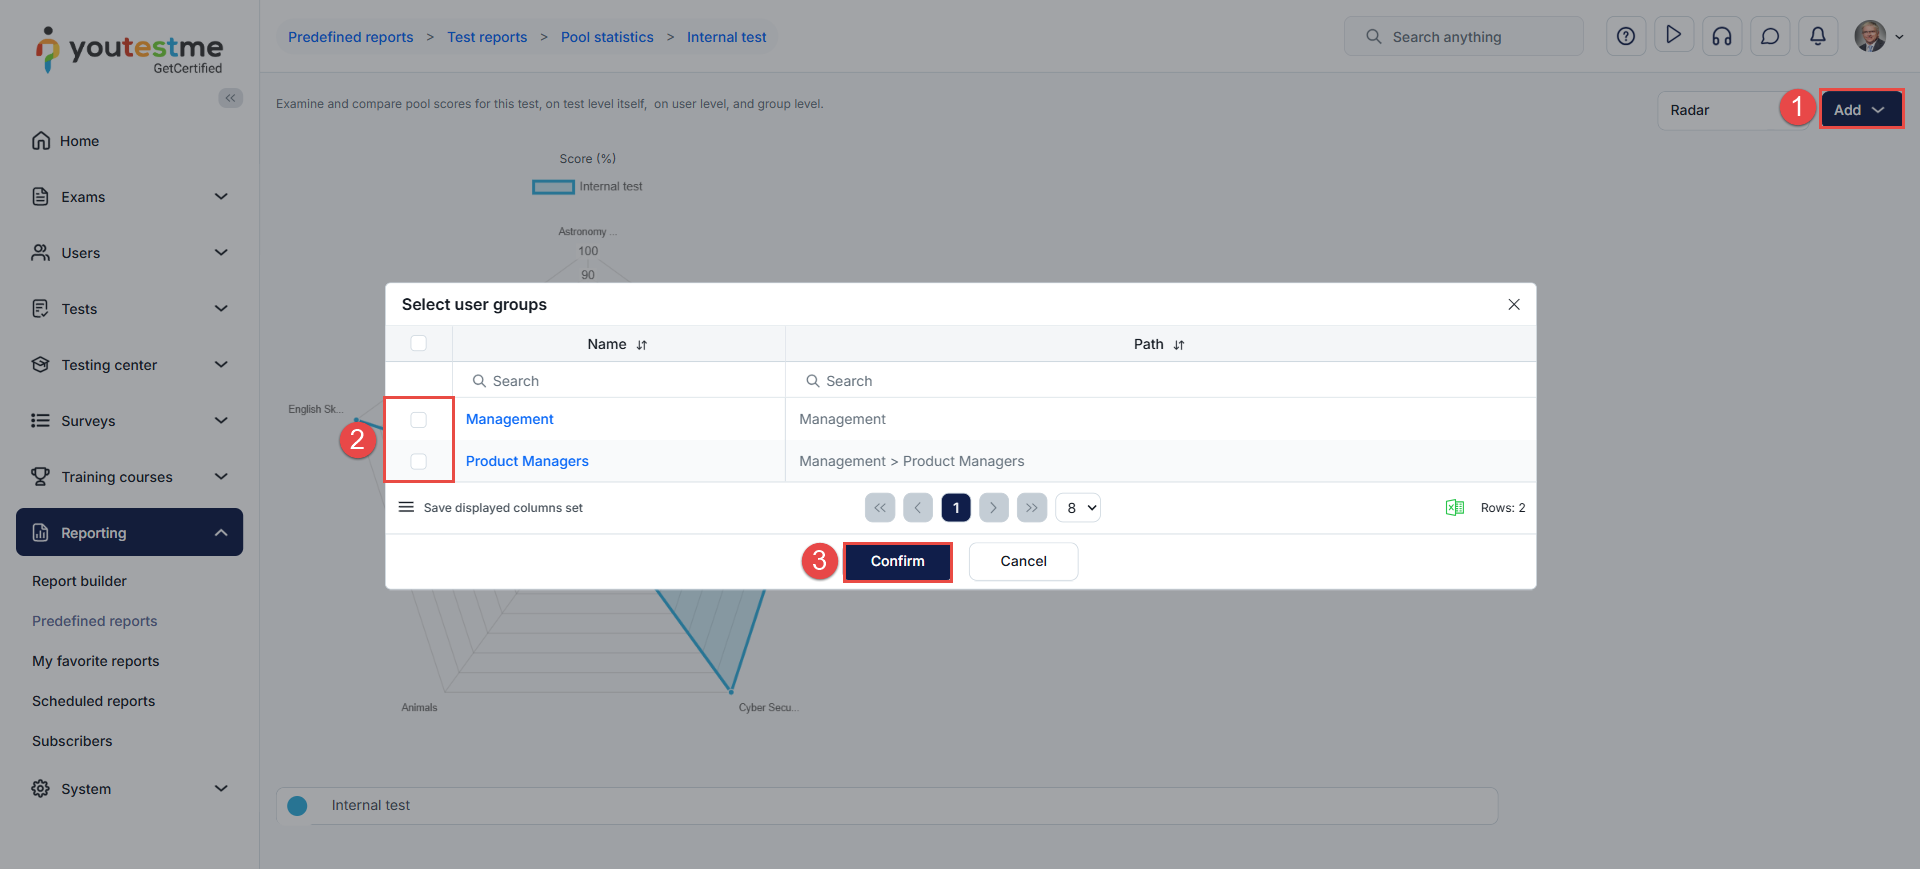
To add user groups to the statistics, follow these steps:
- Click the Add button and select Add user groups.
- When the pop-up window appears, choose the desired user groups.
- Click the Confirm button to save the changes.
Preview of User Group Statistics
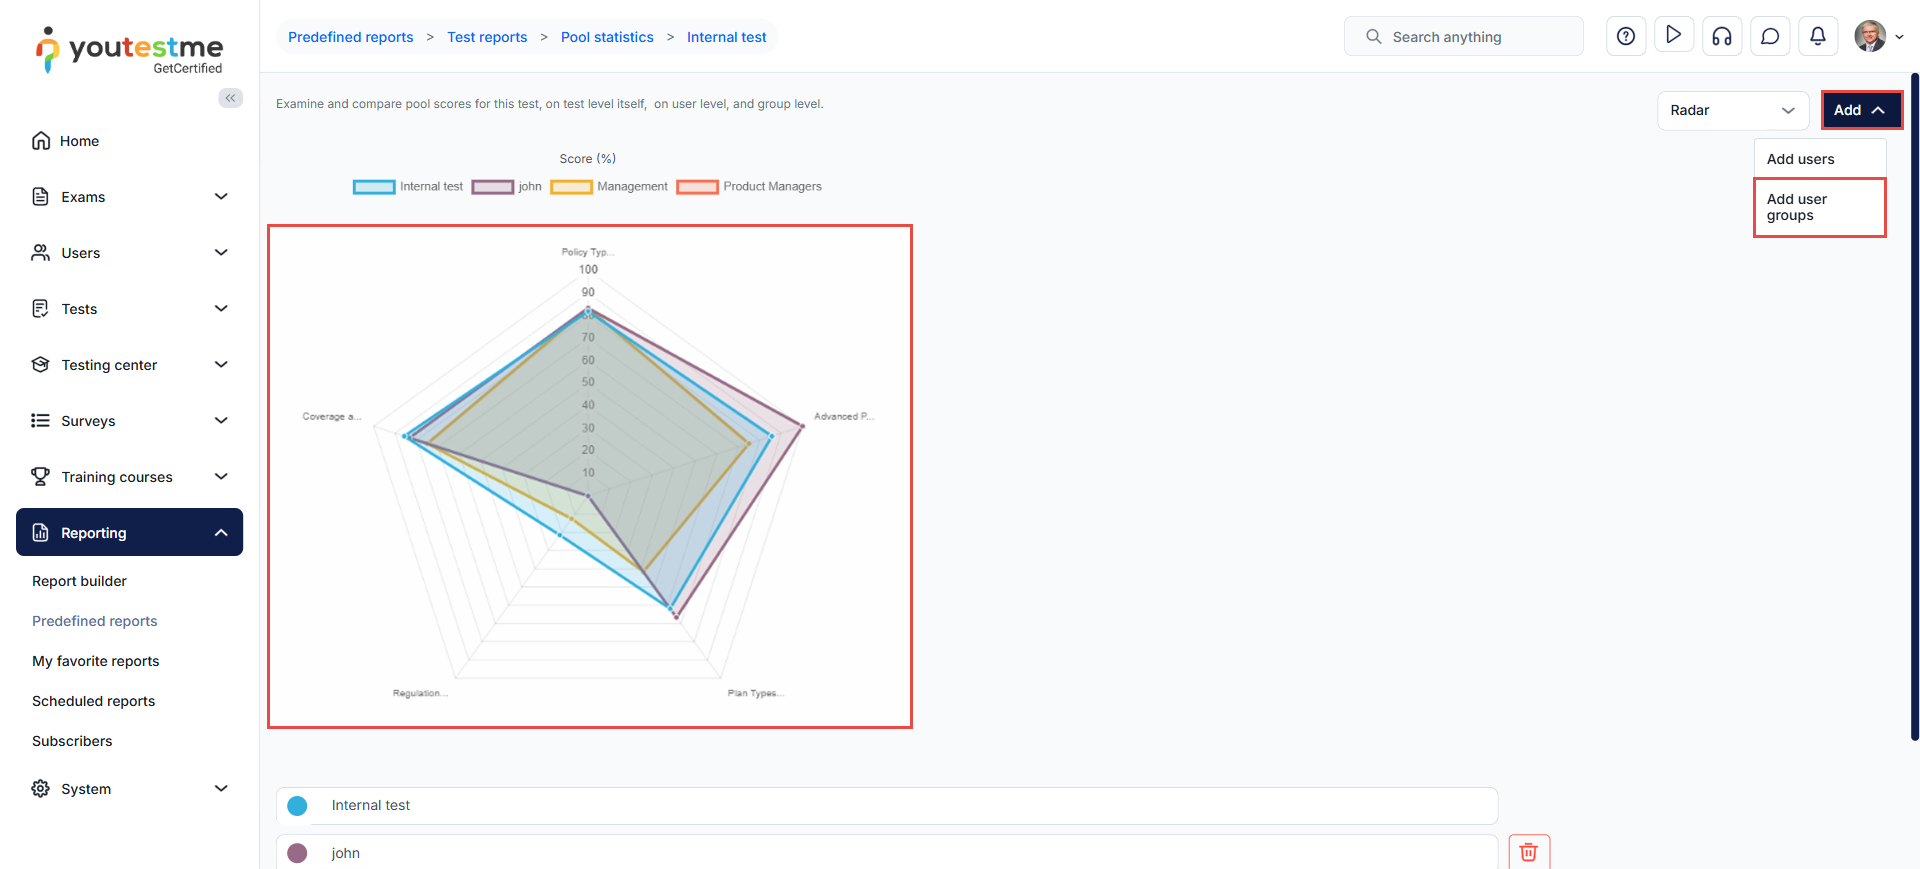
In our example, we have added two user groups:
- On the chart, the average score of all the user groups we’ve added is now displayed for each question pool.
- We can change the chart view; in our case, we’ve selected the Radar display.
- You can add user groups and individual users to the same chart to compare the candidate’s performance with that of the group.
In summary, the option to include user group analysis, along with the ability to add all candidates, customize chart views, and review proficiency levels individually, significantly enhances the versatility and user-friendliness of our system. This feature provides a comprehensive view of candidate performance, enables fine-tuned analysis, and supports data-driven decision-making, making it a valuable tool for optimizing assessments and improving the evaluation process, while also allowing a deeper understanding of group dynamics and performance trends.