
Article verified for Release 15.1 on December 4, 2025
This article provides guidance on accessing two essential reports generated by YouTestMe after a test is completed: the Test Questions Report and the Summary Report.
After a test is completed, the system automatically generates the following statistical reports:
-
Summary Report: Provides insights into the average and median scores, standard deviation, test success ratio, and enables result comparisons across different sessions and testing locations.
-
Test Questions Report: Displays the success ratio for each question, the average time spent answering them, and the percentage of selected answers.
Summary Report
This report provides a comprehensive overview of test attempt results and progress, both globally and by testing session.
Accessing the Summary Report
To access the summary report, please follow these steps:
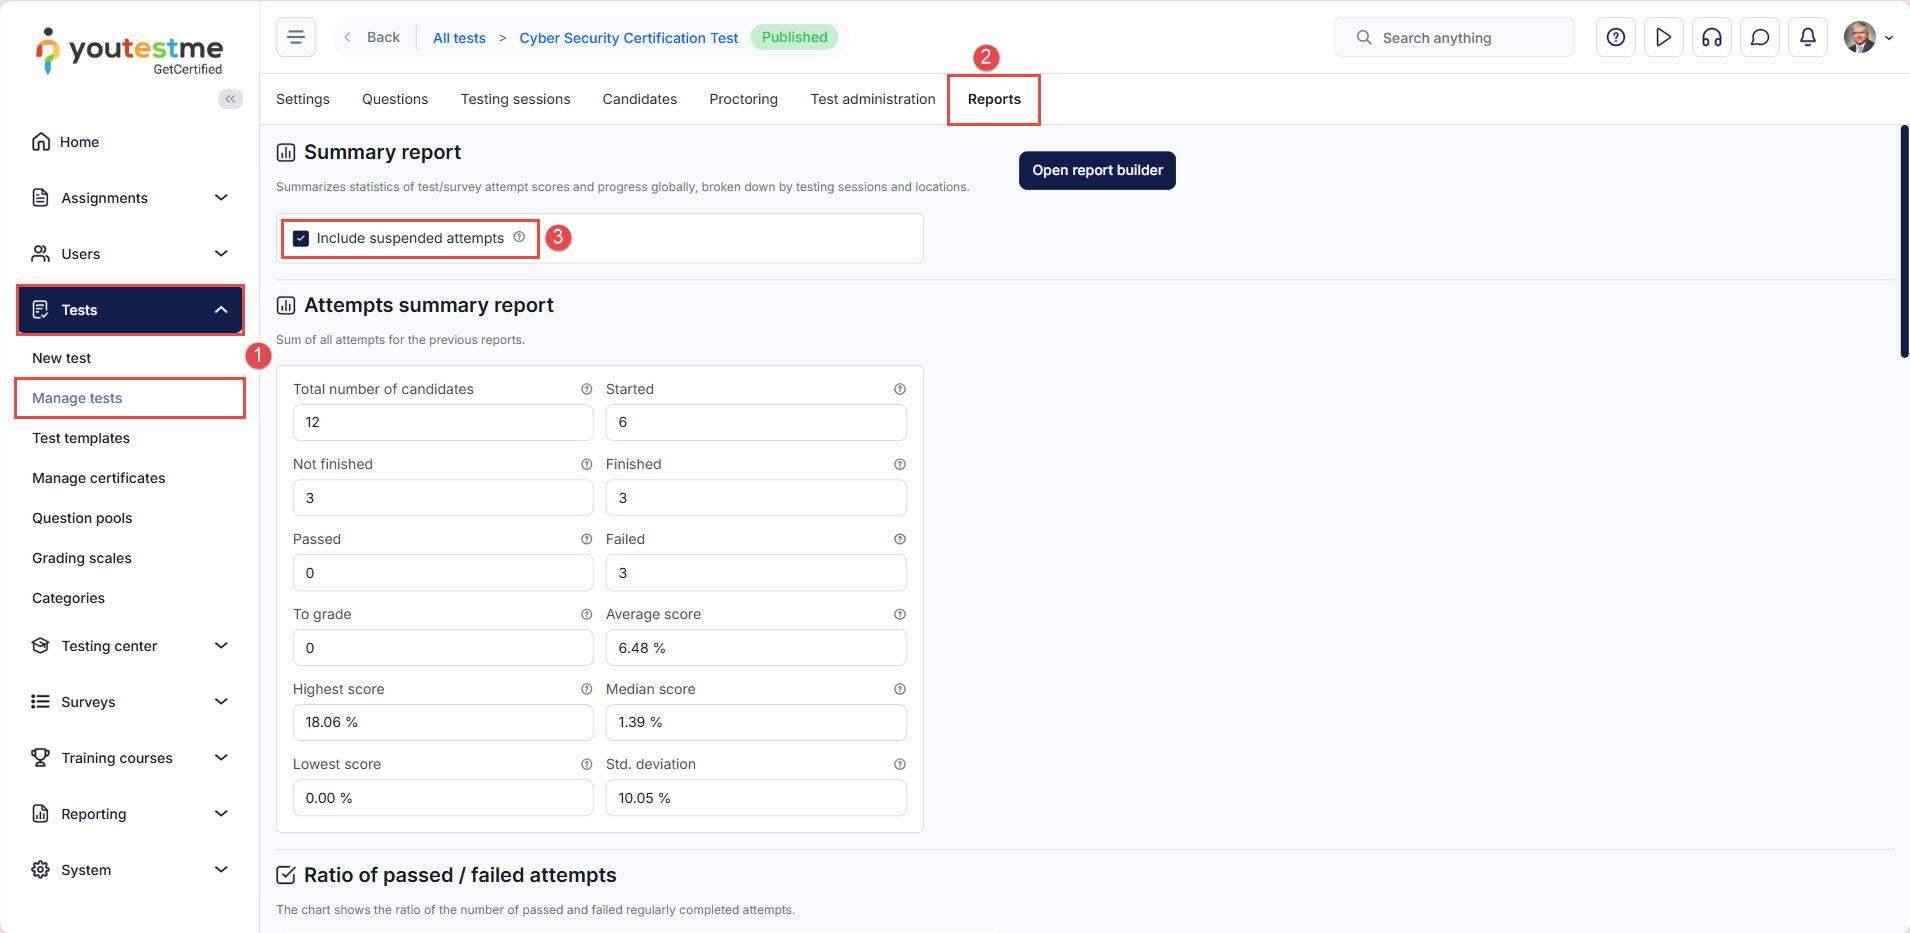
- In the main menu, go to Tests, then the Manage tests tab.
- Click on the name of the desired test and navigate to the Report tab.
- You can include or exclude suspended attempts by selecting or deselecting the checkbox labeled Include Suspended Attempts.
Available Data in the Summary Report
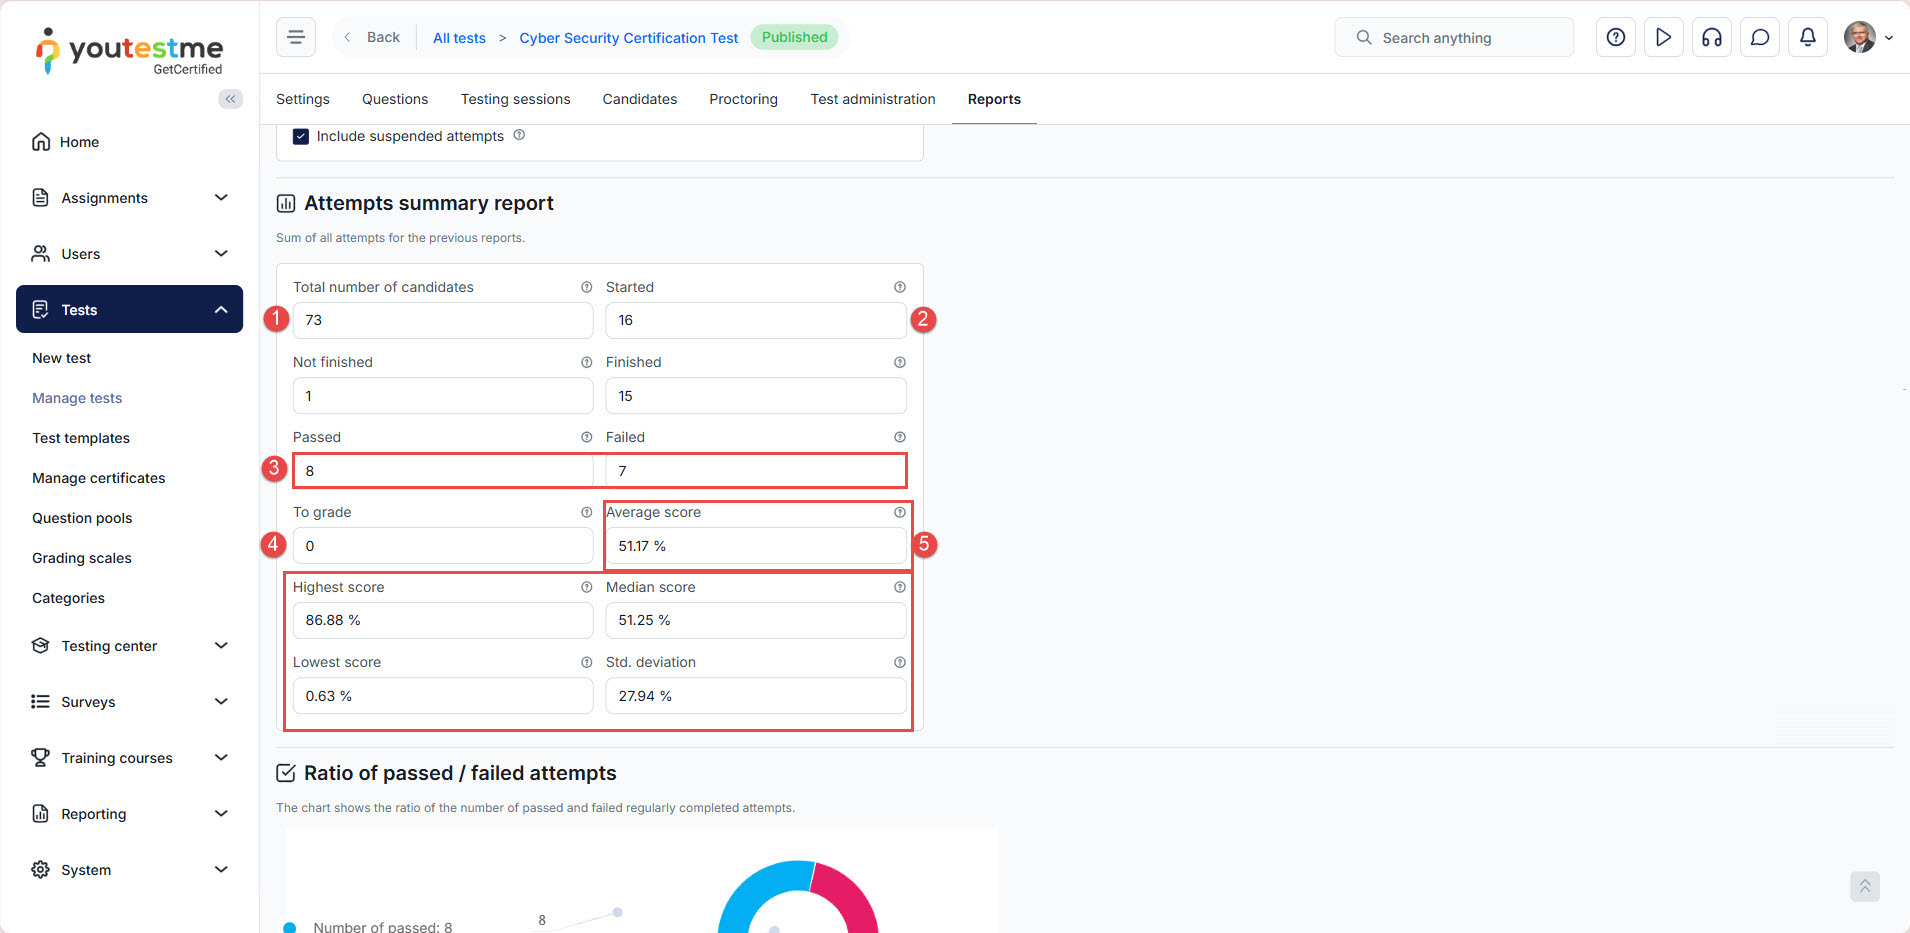
In the Attempts Summary Report, you gain access to comprehensive global statistics related to test attempts, including:
- The total number of candidates who either booked or were assigned to the test.
- The count of candidates who initiated the test, completed it, and didn’t finish.
- The number of candidates who successfully passed the test and those who failed.
- The number of attempts that require grading.
- Key statistics, including the average, lowest, highest, and median scores, along with the standard deviation.
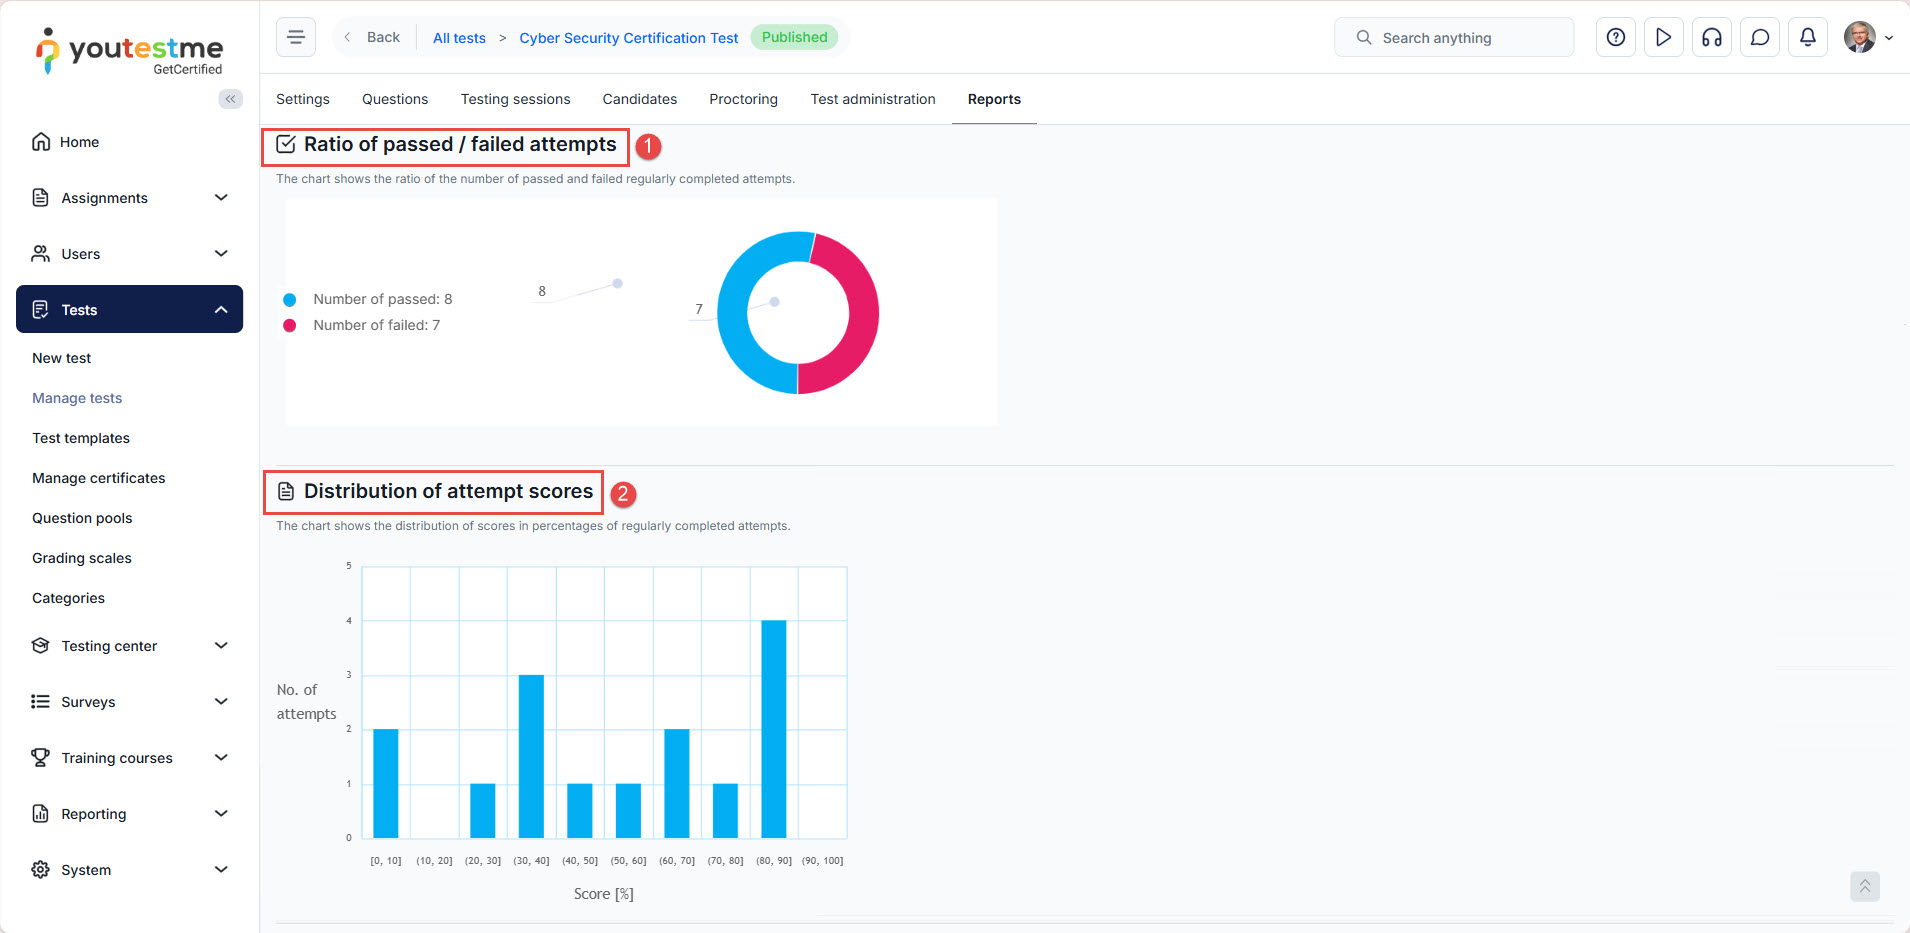
Charts Available
The Summary report also features charts that display:
- The ratio of passed and failed candidates
- The distribution of scores in percentages for attempts that were successfully completed.
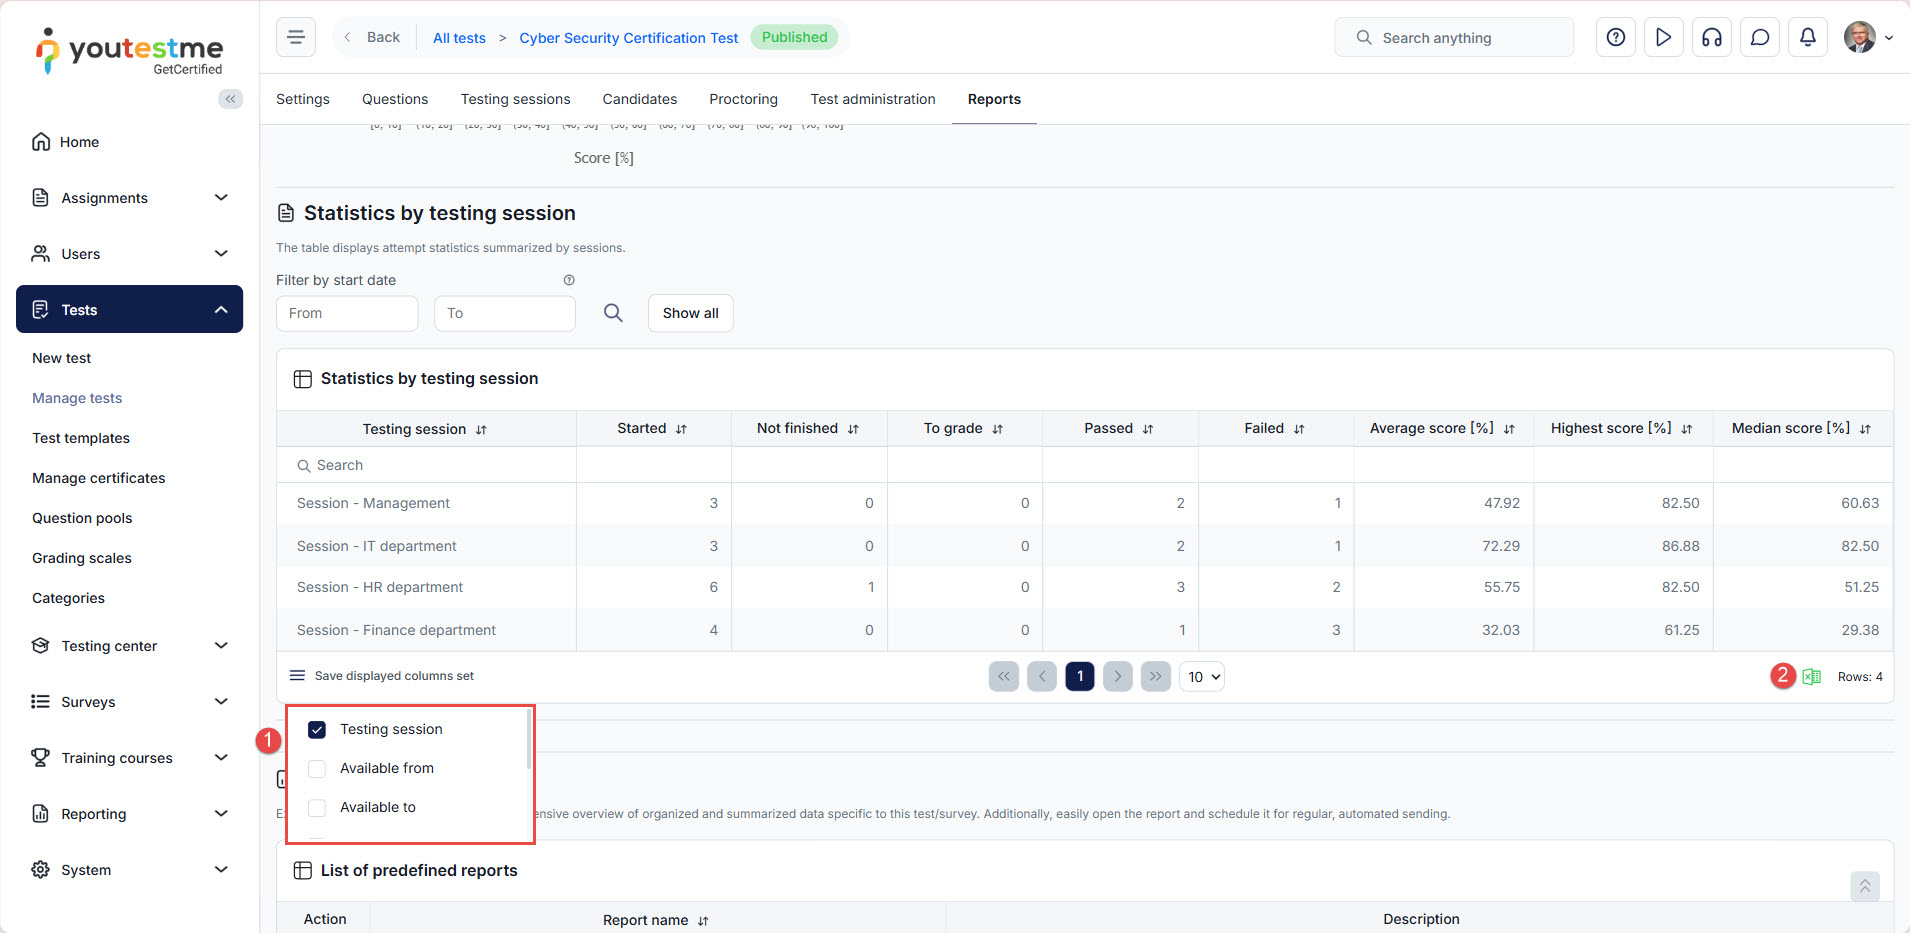
Statistics by Testing Sessions
Alongside the global report, the system generates a statistical report categorized by testing sessions, enabling you to:
- Utilize the filter to select the specific time frame for reviewing the statistics.
- Examine and compare the progress and key statistics for each individual session conducted.
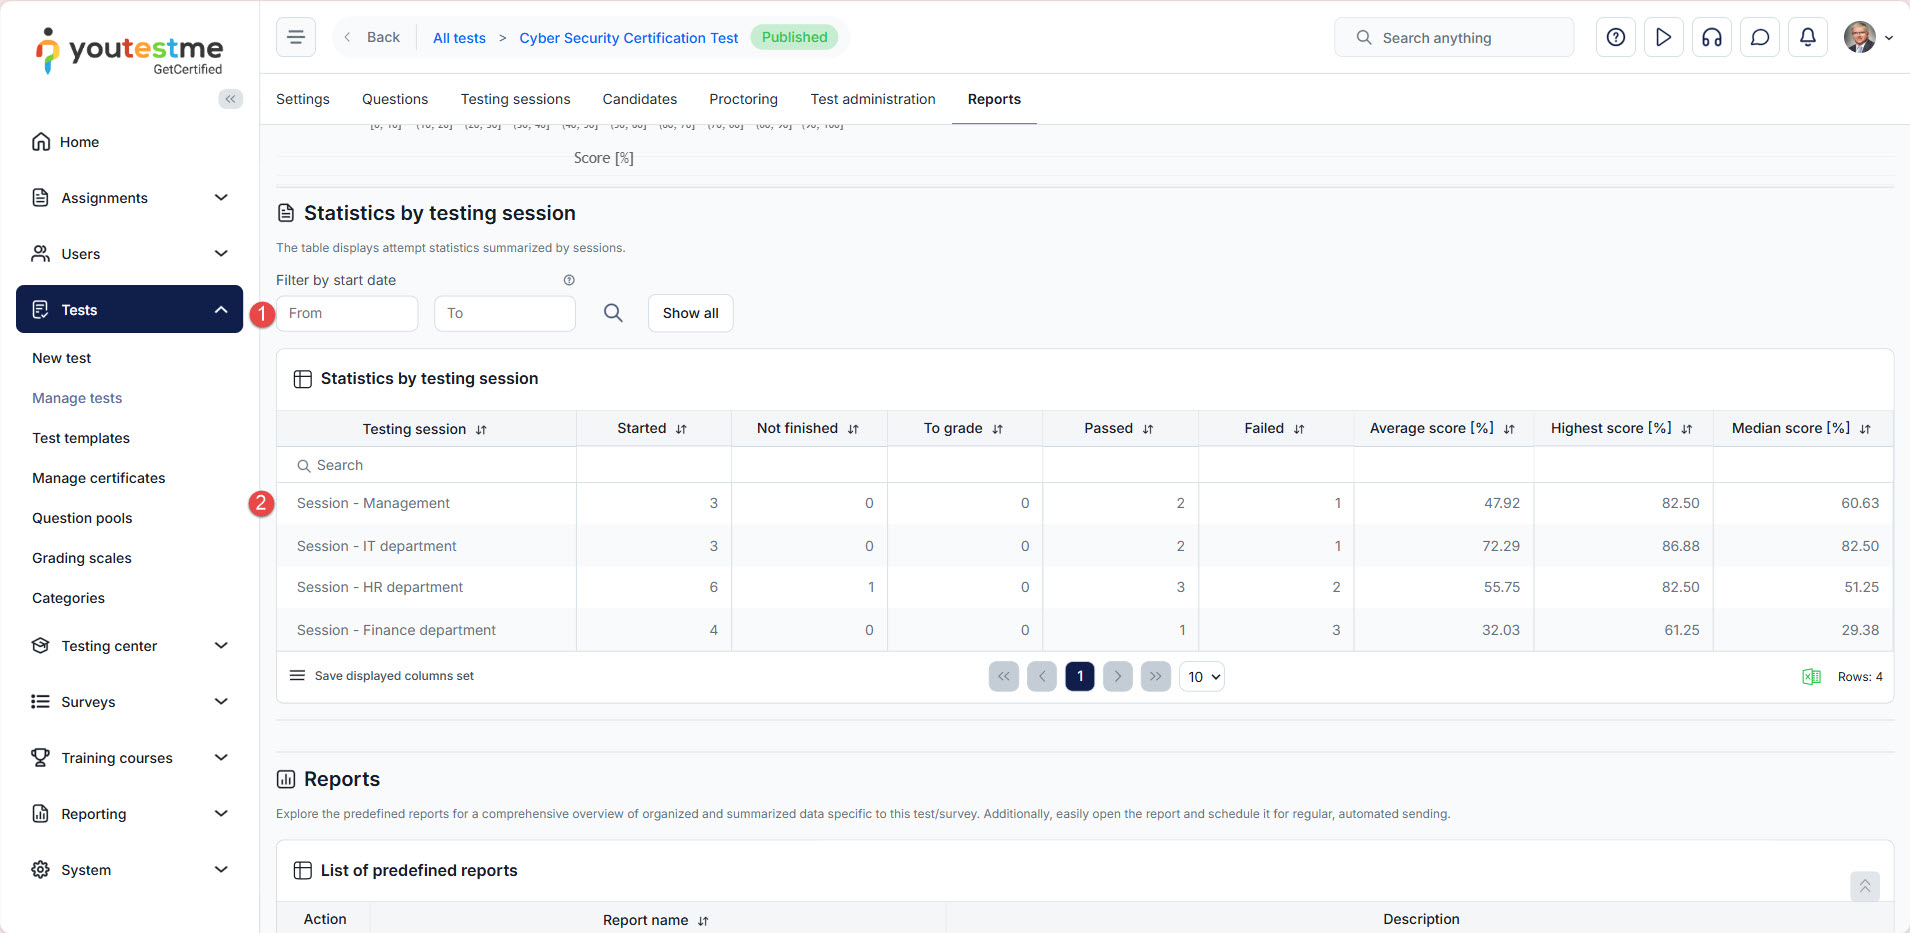
Additional options:
- To select or remove table columns, access the hamburger menu labeled Save displayed columns set. Then, check or uncheck the boxes next to the column names.
- To download the report in Excel format, simply click the corresponding export icon.
Test Questions Report
Questions Report per Test
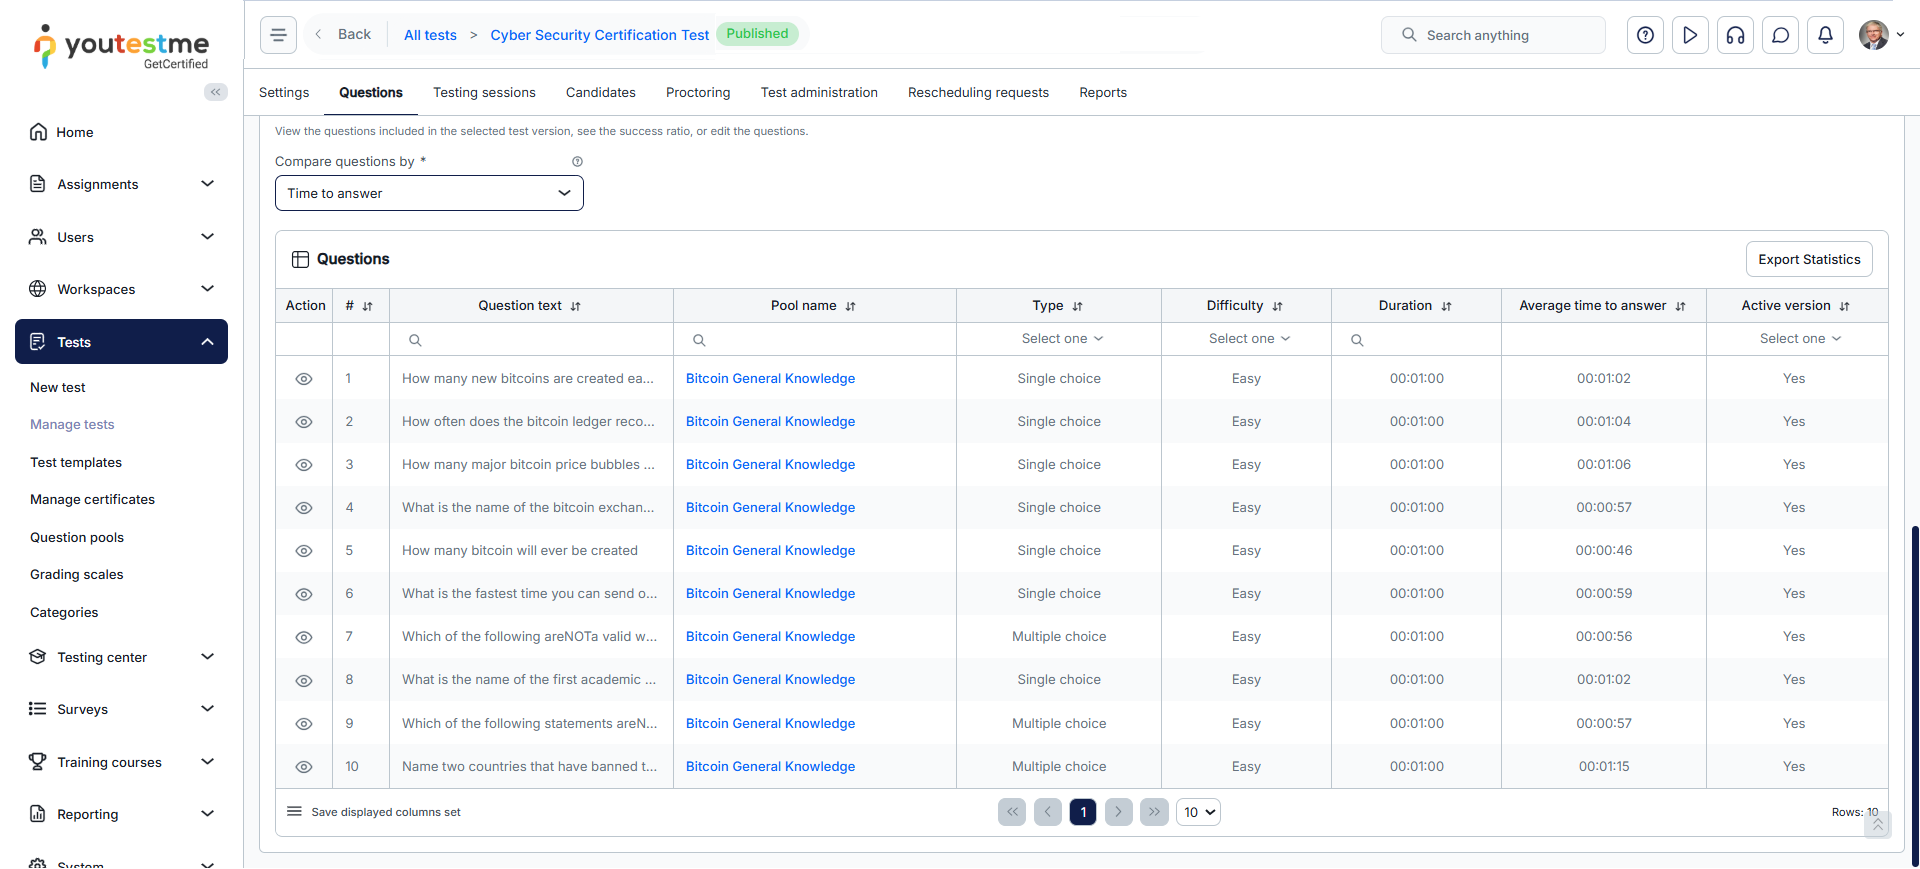
Users can access a detailed questions report through the Questions tab for each test.
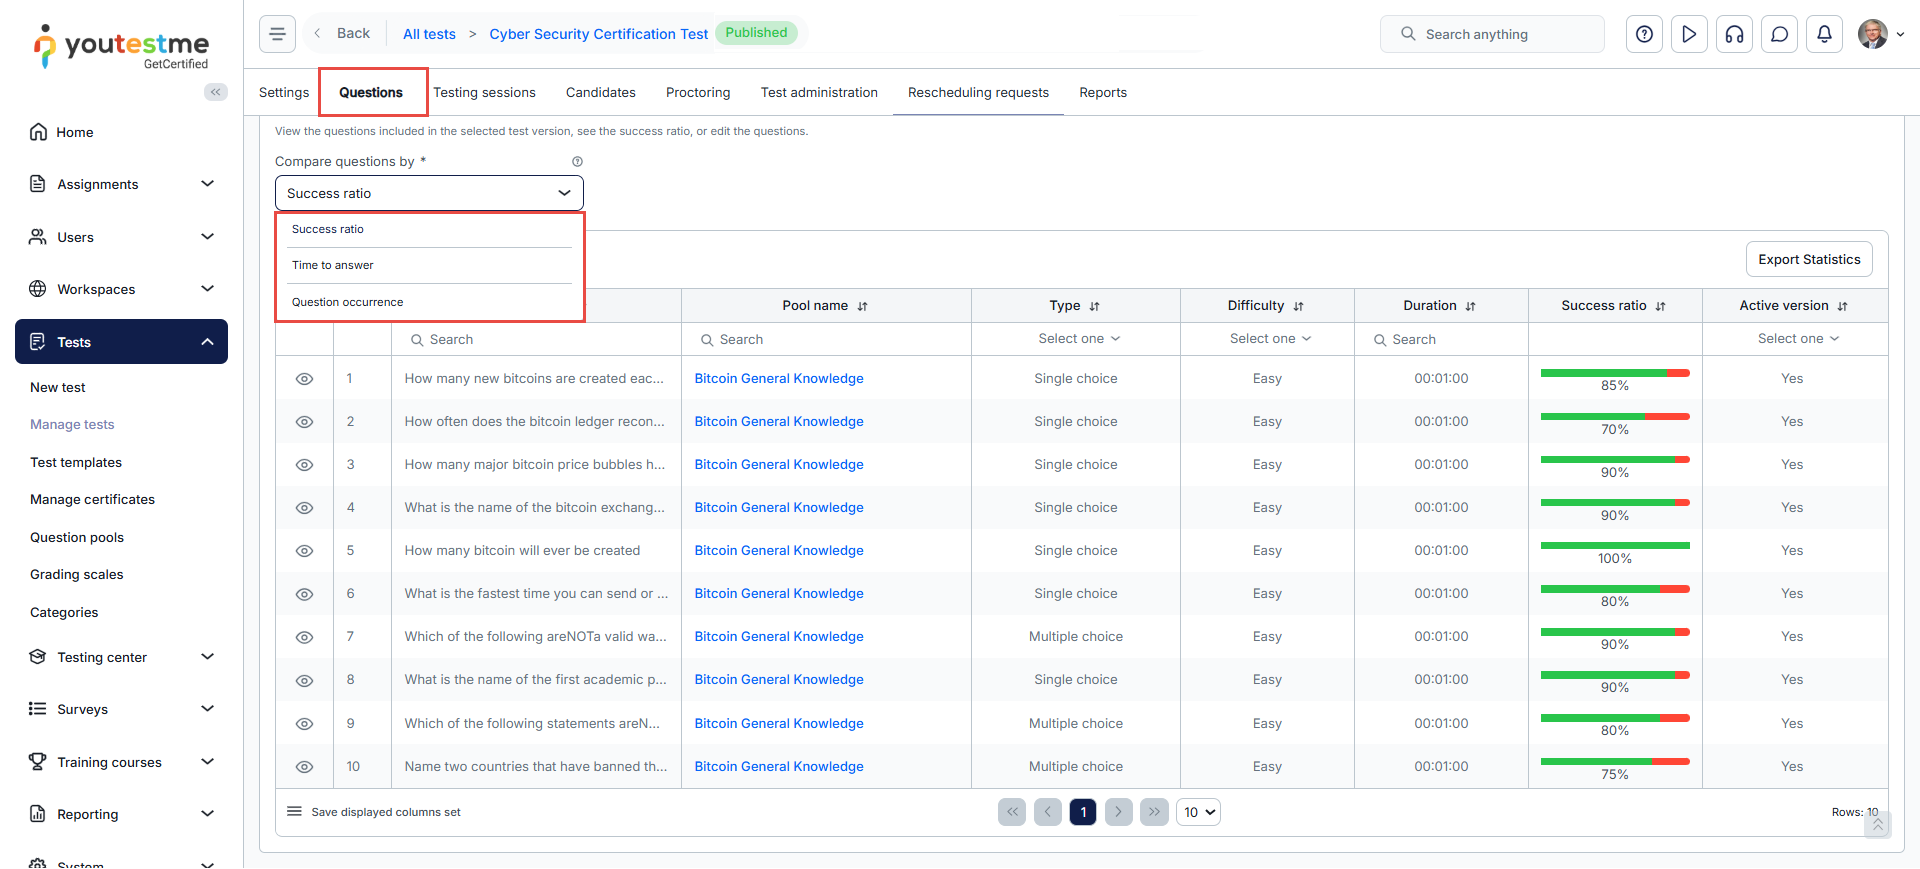
This report provides:
- Success Ratio per Question and Answers: An overview of how test-takers performed on each question.

- Time Statistics per Question: Insights into the average time spent on each question.
Note: This option is available only when the test duration is configured as Time per question.
- Question Occurrence: Data on how frequently each question appears in the test.


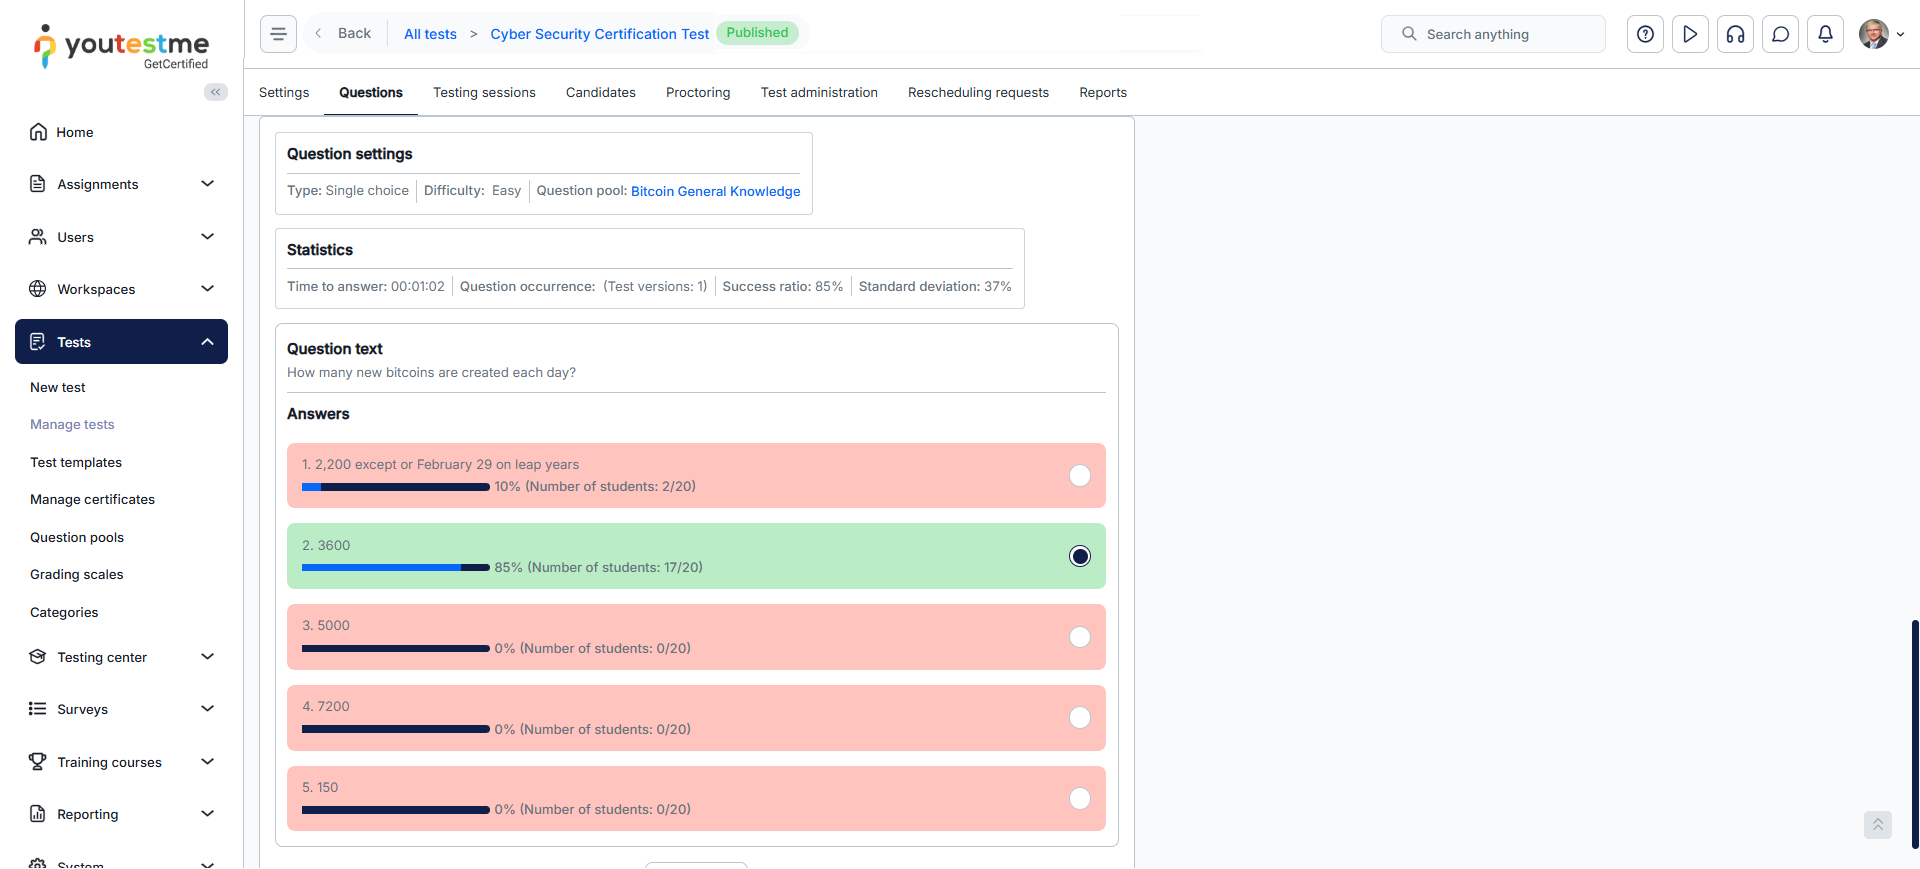
Answers statistics: Users can view detailed statistics for a question’s answers by clicking the Details button in the Actions column for that question. This includes the number of correct and incorrect responses, as well as the percentage of test-takers who selected each answer.
For more related instructional materials, please see: